DAX Hidden Sell Signal on this 4H Golden Cross?DAX (DE40) has been trading within a Channel Up (green) since its 1W MA50 (red trend-line) market bottom and yesterday it formed a 4H Golden Cross. That is technically a bullish pattern but in the past 5 months, every such formation (3 in total) has been an indication of a market Top, thus a bearish signal.
More specifically, the most it took for DAX to form a top after a 4H Golden Cross within this time-frame, has been 4 days. And as you can see it's also been similar Channel Up patterns that peaked after this Cross, on an identical Lower Highs trend-line like the one that the index is about to test.
What's even more striking is that every sell-off that followed the Tops was exactly -5.15%. Identical on all 3 occasions. As a result, it is possible for DAX to decline as low as 23050 following the upcoming top. Since however the 1W MA50 is involved this time as a Support, you may want to book profits there earlier, around 23300, if you see it acting as a Support with strong buying pressure.
---
** Please LIKE 👍, FOLLOW ✅, SHARE 🙌 and COMMENT ✍ if you enjoy this idea! Also share your ideas and charts in the comments section below! This is best way to keep it relevant, support us, keep the content here free and allow the idea to reach as many people as possible. **
---
💸💸💸💸💸💸
👇 👇 👇 👇 👇 👇
DAX Index
No trades
Trade ideas


DAX40 continuation on bullish biasDAX40 SMC retracement into structure and continuing its weekly bias(bullish).

Dax to the upside!Hi
on the 4h TF. Dax bounced strongly from the bottom to break a critical resistance level then went to the next resistance then broke through it to the upside and even bounced up from after it settled on with a pin bar 4H candle and that is the big view of the DAX based on the 4H TF.
3 TPs are there, however, if you accept and tolerate the bearish pullbacks on the journey to TP3, as long the last support level or (the above line) will not be broken by a 4H candle (closing price not by a wick) then TP3 will be your main and real target on DAX.
Fundamentally the next week will offer the Fed interest rate decision which has strong expectations of another rate cut! and may we see currently the preparation on the chart for that move!
Note:
Please do not share or copy my own work! It reflects my own vision and view to that index and it is advertised to not be taken as a legal advice for traders to follow, however, it is not more than an own opinion and analysis to be shared with you!
Good luck ;)

GER30 Potential Long Setup #7 (High Probability Reaction)🧭 MAIN TIMEFRAME (2H) – Directional Bias
🟢 STRONG BULLISH PRESSURE
Multiple groups of traders opened long positions on the left side of the chart, creating sustained bullish pressure and accumulation.
🧩 TRADE SETUP
🔗 Area of High Confluence
🟦 Support Zone
✔ Multiple rejections ( minimum 2 )
✔ Recently formed and respected (close to left-side structure)
🕯 Candlestick Stacking (Buyer Participation)
✔ Takuri Line
✔ Two Inside Bars
✔ Strong bullish momentum candle
📈 Technical Alignment
✔ EMA 50 aligns perfectly with the support zone
✔ Fibonacci 61.8% (Golden Level)
✔ Ascending trendline perfectly aligned
⏱ ENTRY TIMEFRAME – 15 MIN
🔄 Trend Change Confirmations
🔓 Resistance break
🎯 Bollinger Bands squeeze breakout
📐 Trendline breakout
📍 STOP LOSS (Based on 2H Structure)
Placed below:
🟦 Support zone
🕯 Wick rejections
📐 Trendline
📉 EMA 50
🧮 Fibonacci 61.8%
🛡 Strong multi-layer protection for higher trade safety
🎯 TAKE PROFIT AREA 1 (2H)
🔴 Next resistance zone
🧮 Fibonacci extension 50% – 61.8%
High-probability reaction zone
🎯 TAKE PROFIT AREA 2
🧮 Fibonacci extension 100%
High-probability reaction zone
📈 If you appreciate clean, rule-based, and well-explained trading ideas, feel free to follow.
💬 Your thoughts and alternative perspectives are welcome in the comments.
⚠️ DISCLAIMER
This analysis is provided for educational purposes only and does not constitute financial advice.
Trading involves risk — always conduct your own analysis.
I am not responsible for any decisions or losses based on this idea.a.

DAX SELL 4HChart Analysis (DAX Index – 4H)
1. General Trend Context
The chart shows the DAX in a broad corrective structure, moving under a large descending curve (red dashed arc) indicating a medium-term bearish bias.
Price has recently rebounded from the lower support area, but it is still trading below major resistance zones.
2. Key Technical Zones
🔴 Resistance Areas
24,150 – 24,500
Strong resistance cluster made of Fibonacci levels and historical supply.
Also includes the stop zone for the planned short position.
24,825 region
Major swing high and top of the corrective arc.
Bears are expected to dominate here.
🟢 Support Areas
23,400 – 23,000
Important horizontal support (0.5 Fibonacci retracement).
First potential target for bearish movement.
22,300 – 22,000
Strong support zone aligned with deeper Fibonacci levels and historical demand.
21,250 – 21,150
Major long-term support zone.
The projected final bearish target (green target box).
3. Projected Price Path
🟠 Bearish Scenario (Main)
This is the main scenario illustrated by the orange/red movement:
Price rises slightly to the 24,300–24,450 area →
A short entry is triggered with stop at 24,790 →
A strong downward leg begins, targeting:
23,400
22,800
Final target around 21,250 (≈ -11.7%)
This aligns with the long-term descending curve and Fibonacci projections.
4. Alternative Scenario (Bullish Reversal)
🔵 Bullish Path
If the market reaches the 21,250 major support zone, a strong rebound is expected.
This is drawn as the blue arrow.
The bullish move could develop into a trend reversal, potentially pushing back toward:
22,800
23,800
and even higher if momentum strengthens.
5. Trade Setup Displayed
Short Position
Entry: ~24,150
Stop: 24,790
Take-Profit: 21,250
Risk/Reward ≈ 8.27 (very favorable)
This setup is based on hitting a strong resistance zone followed by a long corrective decline.
6. Momentum Indicators
The histogram at the bottom (Awesome Oscillator) shows recent weakening, supporting the bearish continuation scenario.

GER30 H4 | Bearish Reversal?Momentum: Bullish
The price is reacting off the sell entry which aligns with the 145% Fibonacci extension, which adds significant strength to this level.
Sell entry: 24,125.22
Pullback resistance
145% Fibonacci extension
Stop loss: 24,479.29
Swing high resistance
Take profit: 23,684.50
Pullback support.
38.2% Fibonacci retracement.
High Risk Investment Warning
Stratos Markets Limited (tradu.com ), Stratos Europe Ltd (tradu.com ):
CFDs are complex instruments and come with a high risk of losing money rapidly due to leverage. 70% of retail investor accounts lose money when trading CFDs with this provider. You should consider whether you understand how CFDs work and whether you can afford to take the high risk of losing your money.
Stratos Global LLC (tradu.com ): Losses can exceed deposits.
Please be advised that the information presented on TradingView is provided to Tradu (‘Company’, ‘we’) by a third-party provider (‘TFA Global Pte Ltd’). Please be reminded that you are solely responsible for the trading decisions on your account. Any information and/or content is intended entirely for research, educational and informational purposes only and does not constitute investment or consultation advice or investment strategy. The information is not tailored to the investment needs of any specific person and therefore does not involve a consideration of any of the investment objectives, financial situation or needs of any viewer that may receive it. Past performance is not a reliable indicator of future results. Actual results may differ materially from those anticipated in forward-looking or past performance statements. We assume no liability as to the accuracy or completeness of any of the information and/or content provided herein and the Company cannot be held responsible for any omission, mistake nor for any loss or damage including without limitation to any loss of profit which may arise from reliance on any information supplied by TFA Global Pte Ltd.

GER40I'll be looking out for sells this week. Currently approaching D OB and have already swept liquidity. Also there is a low trend-line break and retest.

DAX | Hourly Outlook | BearishI will be looking for shorts from the hourly supply. On the 15m timeframe, we broke structure to the downside. I would like to see price retrace back up to the hourly supply filling the hourly fvg imbalance, and then continue to sell off back to the 15m swing low and fill the 4hr imbalance. Use the 5m/1m for entry confirmation.
Trade Safe -Remzy

15 MIN DAX Short idea 1:3 RR DAX is formin a trading range today december 15, and I am expecting visit of the day's high only for the market to head low.
Friday was a big red bar, so I am trading the short side on the top of indecisive price action.

GER40🎙 Market Update – German DAX
The German DAX is showing clear bearish pressure, and in the coming period, we’re targeting the downside level at 23,890.
This bearish scenario becomes invalid if price reaches 24,250, as a move toward that level signals a potential shift in market structure.
Stay alert and trade with discipline.

GER40 Pullback Is Not a Reversal (Here’s Why)GER40 did not react at the 0.7–0.8 retracement of the previous bearish leg, indicating underlying strength. Price has since formed equal highs (EQH), which now serve as a logical liquidity target for the next upside move.
I expect a brief manipulation or pullback early in the week, followed by bullish expansion toward the 24,500 area.
I’ll share updates as the setup develops — follow for further analysis.

GER 40Where are we going? Germans never stop pushing. Depending on close of this D3 candle, I will determen next move. We had nice bullish momentum for past few days and I am liking it. Time to start posting again on Tradingview, until I get bored and saturated again 😂😂😂

Risk Management Basics 95% of Traders IgnoreWhen traders try to improve their results, they often jump straight to indicators, new setups, or refined entries.
But here’s the uncomfortable truth:
Most traders don’t fail because of their strategy — they fail because they don’t control their risk.
Let’s break down the two fundamentals that separate professionals from the 95%:
1️⃣ The 1% Rule: Your Built-In Survival System
Most beginners risk 5–20% per trade.
Professionals risk a maximum of 1%. Why?
Because the goal isn’t to win every trade — the goal is to stay in the game long enough for your edge to play out.
Risking only 1% means:
✔ A losing streak won’t destroy your account
✔ Your emotions stay stable and rational
✔ Your system has room to unfold statistically
✔ You avoid the #1 account killer: overexposure
Here’s the key mindset shift:
Risk management is not about fear — it’s about increasing your probability of long-term profitability.
2️⃣ Positive Expectancy: The Math Behind Winning Traders
Most traders judge a setup based on the last one or two trades.
Professionals evaluate it based on expectancy — the average profit per trade across a large sample.
Here’s a simple example:
Win rate: 40%
Average win: +60 pips
Average loss: –30 pips
Expectancy =
(0.4 × 60) – (0.6 × 30) = +6 pips per trade
Meaning:
You can lose more trades than you win — and still be profitable.
This is the principle beginners never understand.
A system with positive expectancy + 1% risk per trade becomes extremely powerful.
You stop caring about individual losses and start thinking in probabilities, not emotions.
The Truth Most Traders Miss
➡️ Risk management is the strategy.
➡️ Expectancy matters more than your win rate.
➡️ Risking 1% won’t make you rich fast — but it will prevent you from blowing up.
➡️ Trading becomes easier when you remove the illusion of certainty.
If traders spent more time understanding expectancy and risk instead of chasing “perfect setups,” half of their frustration would disappear overnight.
Thanks for reading — and have a disciplined start to your trading week!
If you found this post valuable, let me know in the comments.
I might create a full series on applied risk management and expectancy modeling.
Jonas Lumpp
Speechless Trading
Disclaimer: This tutorial is for educational purposes only and does not constitute financial advice. Its goal is to help traders develop a professional mindset, improve risk management, and make more structured trading decisions.
Long for DAX, GER40
We have a Bullish Bias on 1W
On daily we are now rejecting from FVG
On 4H we close above first daily rejection
Entry from FVA on 4H
Stop below bullish candle
TP = 2R

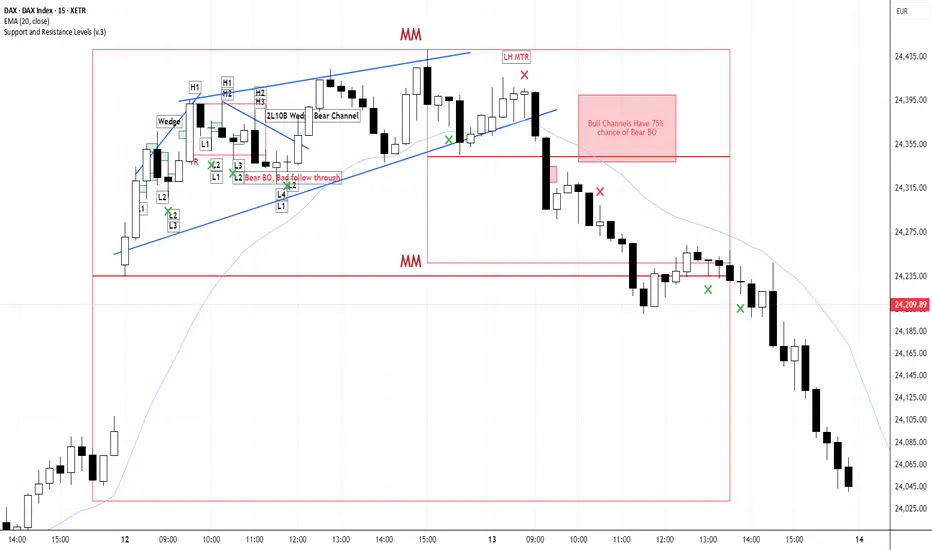
DAX (15m) Major Trend Reversal using Al Brooks MethodSmall Green Boxes are Buys and Red Sells (which were many, but too lazy to draw them:)))
DAX long after a strong correction-DAX formed an invers head and sholders now I'm very bullish on indices after a very deep correction

Ger30We can see that price has restest the previous demand zone to be strong level of support, and more bullish momentumm still expected till the supply formed.


DAX at a Historical Ceiling (Breakout or Breakdown Ahead?)Price is stuck under a major multi-month resistance zone at 24,600–24,800, while SMA50 acts as support around 23,980.
The market is in a critical decision zone.
Bullish Scenario — if price closes above 24,800:
• Target 1: 25,400
• Target 2: 26,000
• Target 3: 26,500
• Stop-loss: Below 24,600
Bearish Scenario — if price rejects and falls below 24,150:
• Target 1: 23,700
• Target 2: 23,300
• Target 3: 22,800
• Stop-loss: Above 24,400
Short Fundamental Overview
• EU inflation cooling; ECB remains cautious
• German corporates stable but economic growth is soft
• Market needs a clear breakout to confirm direction

DAX pivotal resistance at 23870The DAX remains in a bullish trend, with recent price action showing signs of a breakout within the broader uptrend.
Support Zone: 23870 – a key level from previous consolidation. Price is currently testing or approaching this level.
A bullish rebound from 23870 would confirm ongoing upside momentum, with potential targets at:
24300 – initial resistance
24450 – psychological and structural level
24560 – extended resistance on the longer-term chart
Bearish Scenario:
A confirmed break and daily close below 23870 would weaken the bullish outlook and suggest deeper downside risk toward:
23712 – minor support
23600 – stronger support and potential demand zone
Outlook:
Bullish bias remains intact while the DAX holds above 23870. A sustained break below this level could shift momentum to the downside in the short term.
This communication is for informational purposes only and should not be viewed as any form of recommendation as to a particular course of action or as investment advice. It is not intended as an offer or solicitation for the purchase or sale of any financial instrument or as an official confirmation of any transaction. Opinions, estimates and assumptions expressed herein are made as of the date of this communication and are subject to change without notice. This communication has been prepared based upon information, including market prices, data and other information, believed to be reliable; however, Trade Nation does not warrant its completeness or accuracy. All market prices and market data contained in or attached to this communication are indicative and subject to change without notice.

Dax for Monday 15th DecemberAbove 24350 does not seem to be liked
Still in an uptrend....Bulls still there
Can they hold on .?

DAX BULLISH BIAS|LONG|
✅DAX has broken above the descending trendline with strong displacement, signaling a shift in market structure. A continuation move is favored as liquidity builds above recent highs. Time Frame 5H.
LONG🚀
✅Like and subscribe to never miss a new idea!✅
