DAX trade ideas
DAX Elliott Wave Analysis for Thursday 14/09/2023The primary scenario (in green) is playing out and it looks like we finished wave (X). We can expect more downside as a wave (Y). In our move down, we should first see some upside as a wave ((b)) or wave ((2)). The secondary scenario (in red) assumes more upside as a corrective wave B. That would mean we get an ABC flat correction instead of a WXY.

the inflation data (CPI) will be released. the inflation data (CPI) will be released.
Current: 3.2%, average forecast: 3.6%, expected to increase.
Consumer Price Index Expectations for Financial Institutions (Inflation):
(Lowest: 3.5% Highest: 3.7%)
Visa 3.5%
Canadian Imperial Bank 3.5%
Goldman Sachs 3.6
Bloomberg 3.6%
JP Morgan 3.6%
Mr. Wolf Capital 3.6%
Morgan Stanley 3.6%
Royal Bank 3.6%
Scotia bank 3.6%
TD 3.6%
Wells Fargo 3.6%
Barclays 3.7%
Nomura 3.7%
City 3.7%
HSBC 3.7%
UPS 3.7%
-average 3.6%

DAX Elliott Wave Analysis for Wednesday 13/09/2023The primary scenario (in green) is playing out and it looks like we finished wave (X). We can expect more downside as a wave (Y). In our move down, we should first see some upside as a wave ((b)) or wave ((2)). The secondary scenario (in red) assumes more upside as a corrective wave B. That would mean we get an ABC flat correction instead of a WXY.

CFD good idea Ger30 : SELLHey guy
Plan Ger30 14-15/9/2023 .
Buy Ger30 entry ~1.5770
STOPLOSS AND TP as picture .
R:R 1:3,5
Good lucky everybody
Thanks-
-----------------------------------------
Best regards.

Bearish scenario for DAX.After the break of the symmetrical triangle, the index is likely to seek its first target.
It is common for bearish breakouts to have pullbacks.
Attention to the proportions of these next moves, any sign of fragility will be relevant as triangle breakouts can be canceled without much difficulty.

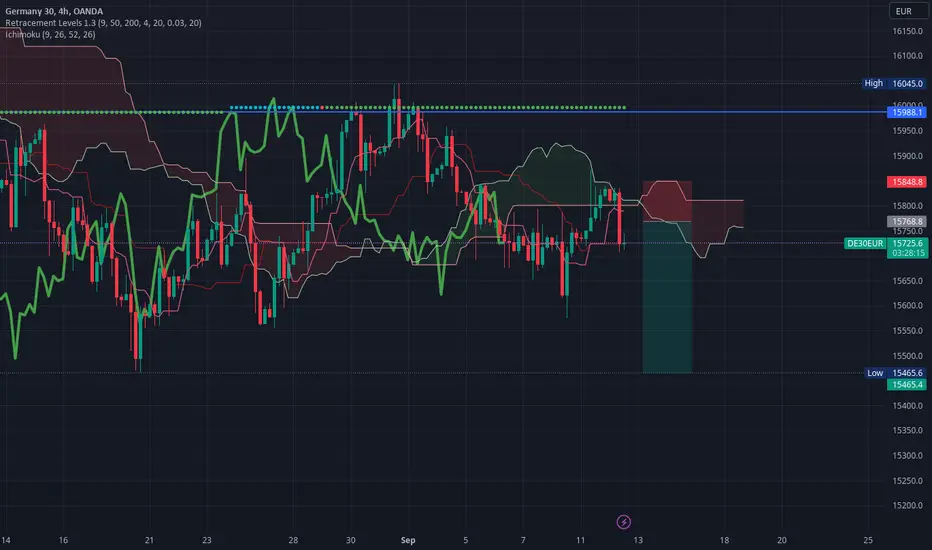
GER 30 H4 | Bullish bounce off 61.8% fibo?Price is currently bearish, and we could possibly see a bounce from our buy entry at 15676.2, which is a pullback support level, aligning with the 61.8% fibo retracement. Our stop loss is at 15563.3, which is a swing low support level, and slightly beyond the 78.6% fibo projection. Take profit is at 15838.1, which is a multi-swing high resistance level.
High Risk Investment Warning
Trading Forex/CFDs on margin carries a high level of risk and may not be suitable for all investors. Leverage can work against you.
Forex Capital Markets Limited (www.fxcm.com):
CFDs are complex instruments and come with a high risk of losing money rapidly due to leverage. 70% of retail investor accounts lose money when trading CFDs with this provider. You should consider whether you understand how CFDs work and whether you can afford to take the high risk of losing your money.
Stratos Europe Ltd, previously FXCM EU Ltd (www.fxcm.com):
CFDs are complex instruments and come with a high risk of losing money rapidly due to leverage. 74% of retail investor accounts lose money when trading CFDs with this provider. You should consider whether you understand how CFDs work and whether you can afford to take the high risk of losing your money.
FXCM Australia Pty. Limited (www.fxcm.com):
Trading FX/CFDs carries significant risks. FXCM AU (AFSL 309763), please read the Financial Services Guide, Product Disclosure Statement, Target Market Determination and Terms of Business at www.fxcm.com
Stratos Global LLC (www.fxcm.com):
Losses can exceed deposits.
Please be advised that the information presented on TradingView is provided to FXCM (‘Company’, ‘we’) by a third-party provider (‘TFA Global Pte Ltd’). Please be reminded that you are solely responsible for the trading decisions on your account. There is a very high degree of risk involved in trading. Any information and/or content is intended entirely for research, educational and informational purposes only and does not constitute investment or consultation advice or investment strategy. The information is not tailored to the investment needs of any specific person and therefore does not involve a consideration of any of the investment objectives, financial situation or needs of any viewer that may receive it. Kindly also note that past performance is not a reliable indicator of future results. Actual results may differ materially from those anticipated in forward-looking or past performance statements. We assume no liability as to the accuracy or completeness of any of the information and/or content provided herein and the Company cannot be held responsible for any omission, mistake nor for any loss or damage including without limitation to any loss of profit which may arise from reliance on any information supplied by TFA Global Pte Ltd.
The speaker(s) is neither an employee, agent nor representative of FXCM and is therefore acting independently. The opinions given are their own, constitute general market commentary, and do not constitute the opinion or advice of FXCM or any form of personal or investment advice. FXCM neither endorses nor guarantees offerings of third party speakers, nor is FXCM responsible for the content, veracity or opinions of third-party speakers, presenters or participants.

DAX Rebounding on this Support.DAX / Germany 40 is technically stuck inside the 1day MA200 (support) and 1day MA50 (resistance).
Friday's bullish reversal to close the 1day candle flat, paved the wave for today's green candle.
Following August's 18th Double Bottom that started the Rising Support (that has closed all candles over it), we expect a continuation of this rise, at least on the short term.
Buy and target 16045, which is a little under Resistance A.
Previous chart:
Follow us, like the idea and leave a comment below!!

DAX Elliott Wave Analysis for Tuesday 12/09/2023The primary scenario (in green) is playing out and it looks like we finished wave (X). We can expect more downside as a wave (Y). In our move down, we should first see some upside as a wave ((b)) or wave ((2)). The secondary scenario (in red) assumes more upside as a corrective wave B. That would mean we get an ABC flat correction instead of a WXY.

GER30 H4 | Bearish reaction off 61.8% fibo?Price is approaching our sell entry at 15840.8, which is an overlap resistance level and aligning with the 61.8% fibo retracement level. Our stop loss is at 15956.1, which is a swing high resistance level and at the 78.6% fibo retracement. Take profit is at the multi swing low support level.
High Risk Investment Warning
Trading Forex/CFDs on margin carries a high level of risk and may not be suitable for all investors. Leverage can work against you.
Forex Capital Markets Limited (www.fxcm.com):
CFDs are complex instruments and come with a high risk of losing money rapidly due to leverage. 70% of retail investor accounts lose money when trading CFDs with this provider. You should consider whether you understand how CFDs work and whether you can afford to take the high risk of losing your money.
Stratos Europe Ltd, previously FXCM EU Ltd (www.fxcm.com):
CFDs are complex instruments and come with a high risk of losing money rapidly due to leverage. 74% of retail investor accounts lose money when trading CFDs with this provider. You should consider whether you understand how CFDs work and whether you can afford to take the high risk of losing your money.
FXCM Australia Pty. Limited (www.fxcm.com):
Trading FX/CFDs carries significant risks. FXCM AU (AFSL 309763), please read the Financial Services Guide, Product Disclosure Statement, Target Market Determination and Terms of Business at www.fxcm.com
Stratos Global LLC (www.fxcm.com):
Losses can exceed deposits.
Please be advised that the information presented on TradingView is provided to FXCM (‘Company’, ‘we’) by a third-party provider (‘TFA Global Pte Ltd’). Please be reminded that you are solely responsible for the trading decisions on your account. There is a very high degree of risk involved in trading. Any information and/or content is intended entirely for research, educational and informational purposes only and does not constitute investment or consultation advice or investment strategy. The information is not tailored to the investment needs of any specific person and therefore does not involve a consideration of any of the investment objectives, financial situation or needs of any viewer that may receive it. Kindly also note that past performance is not a reliable indicator of future results. Actual results may differ materially from those anticipated in forward-looking or past performance statements. We assume no liability as to the accuracy or completeness of any of the information and/or content provided herein and the Company cannot be held responsible for any omission, mistake nor for any loss or damage including without limitation to any loss of profit which may arise from reliance on any information supplied by TFA Global Pte Ltd.
The speaker(s) is neither an employee, agent nor representative of FXCM and is therefore acting independently. The opinions given are their own, constitute general market commentary, and do not constitute the opinion or advice of FXCM or any form of personal or investment advice. FXCM neither endorses nor guarantees offerings of third party speakers, nor is FXCM responsible for the content, veracity or opinions of third-party speakers, presenters or participants.

German30 bullish setup for Monday I've got a trade idea to take the German30 higher within tomorrow's trading session. Price seems to be seeking buy side liquidity.

DAX Elliott Wave Analysis for Monday 11/09/2023 (+ Higher TF)For traders (lower timeframe):
The primary scenario (in green) is playing out and it looks like we finished wave (X). We can expect more downside as a wave (Y). In our move down, we should first see some upside as a wave ((b)) or wave ((2)). The secondary scenario (in red) assumes more upside as a corrective wave B. That would mean we get an ABC flat correction instead of a WXY.
For investors (higher timeframe):
In the higher timeframe, the higher level wave ((1)) is probably finished. There is also an alternative scenario where we can make one more high to finish wave ((1)). This wave ((1)) should be followed by a wave ((2)) to the downside which is an interesting buying opportunity for investors. The wave ((2)) is currently unfolding as a WXY structure. Investors should buy the Y leg.


DAX at a very important decision pointDAX almost reached the low of a channel also near the intersection of a curve and a arc, so , market is bound to take a decision possibly by the week end

DAX Trading plan within this 1H Channel DownDAX is within a Channel Down pattern on the 1H time-frame and just bounced back to its top (Lower Highs trend-line), hitting the 1H MA50 (blue trend-line) immediately. As long as the price remains within the Channel Down, sell and target the Inner Lower Lows trend-line at 15525.
With the 1H MACD just forming a Bullish Cross that high for the first time since September 01, it is equally likely to see a bullish break-out above the Channel. We will buy if it breaks above the 0.5 Fibonacci level, which should coincide with a 1H MA200 (orange trend-line) test. In that case our target will be 15940 (the 0.786 Fibonacci).
-------------------------------------------------------------------------------
** Please LIKE 👍, FOLLOW ✅, SHARE 🙌 and COMMENT ✍ if you enjoy this idea! Also share your ideas and charts in the comments section below! **
-------------------------------------------------------------------------------
💸💸💸💸💸💸
👇 👇 👇 👇 👇 👇

Dax ready for upside move For all trade based on my trade setup -
Risky trades can take trade after crossing 23.6% on either side and safe traders can take trade after 41% We can start buying when our Trailing SL hit at 23.6% with SL of recent low our Target will be 41%, 78.6% , 127.2% 161.8% and 223.6 % , when reversal pattern appears on chart we have to trail our SL if trailing SL hit exit from long trade and initiate sell trade ,

DAX Elliott Wave Analysis for Friday 08/09/2023The primary scenario (in green) is playing out and it looks like we finished wave (X). We can expect more downside as a wave (Y). The secondary scenario (in red) assumes more upside as a corrective wave B. That would mean we get an ABC flat correction instead of a WXY.

DAX: Low risk buy here but exit below the 1D MA200.DAX got rejected on the 1D MA50 and pulled back to the bottom of the Channel Up again. The 1D technical outlook turned bearish (RSI = 43.037, MACD = -52.700, ADX = 29.821) a closing under the 1D MA200 confirms a long term bearish reversal. Until that happens, we will be bullish on this bottom structure, targeting R1 (TP = 16,530).
## If you like our free content follow our profile to get more daily ideas. ##
## Comments and likes are greatly appreciated. ##

DE40 Analysis. Another signal!!!Hello Everyone. I want share my idea about DE 40.
Last time i shared another signal with entry point which was absolutely clear short position entry ( I will link this idea in this post).
now i will try short one more time and the reason is it looking pretty bearish at low timeframe, today we got some good reaction from Daily timeframe witch double top but how it see it didn't work and it was only buyside liquidity.
In my opinion it little bit risky but this index last time gave me really good profit for that i decide to short one more time and here me setup.
Entry point - 15790.
Stop loss - 15825.
Take profit - 15675.
Good luck everyone!!!
Manage your risk!!!

DIAGONALHello friends, I hope you are having a productive week.
I would like to share my ideas on the Elliott Wave Principle with you.
Please refer to the attached chart for more information. If you are interested, you can also check out my previous analysis.
I want to mention that my understanding of this principle is based on my personal experience and I am still learning, but I hope to provide better analysis in the future.
Thank you for your continued support and I look forward to our mutual success.
Best regards, Mr. Nobody.
Go up and never stop.

Degree CorrectionHello friends, I hope you are having a productive week.
I would like to share my ideas on the Elliott Wave Principle with you.
Please refer to the attached chart for more information. If you are interested, you can also check out my previous analysis.
I want to mention that my understanding of this principle is based on my personal experience and I am still learning, but I hope to provide better analysis in the future.
Thank you for your continued support and I look forward to our mutual success.
Best regards, Mr. Nobody.
Go up and never stop.

DAX Elliott Wave Analysis for Thursday 07/09/2023The primary scenario (in green) is playing out and it looks like we finished wave (X). We can expect more downside as a wave (Y). The secondary scenario (in red) assumes more upside as a corrective wave B. That would mean we get an ABC flat correction instead of a WXY.

its time for a GER30 buy as it broke out of the downtrend.GER30 broke the downtrend and retested,we are now looking for a short term buy. we also saw a break and retest of the 21SMA indicating a buy.
