DAX long after a strong correction-DAX formed an invers head and sholders now I'm very bullish on indices after a very deep correction
DAX Index
No trades
Trade ideas

GER30 H4 | Bullish Bounce Off key SupportMomentum: Bearish
Price is currently falling toward the buy entry, which acts as an overlap support level.
Buy Entry: 89,034.03
Overlap support
Stop Loss: 81,966.16
Pullback support
Take Profit: 104,866.08
Overlap resistance
Slightly above the 61.8% Fibonacci retracement
High Risk Investment Warning
Stratos Markets Limited (tradu.com ), Stratos Europe Ltd (tradu.com ):
CFDs are complex instruments and come with a high risk of losing money rapidly due to leverage. 70% of retail investor accounts lose money when trading CFDs with this provider. You should consider whether you understand how CFDs work and whether you can afford to take the high risk of losing your money.
Stratos Global LLC (tradu.com ): Losses can exceed deposits.
Please be advised that the information presented on TradingView is provided to Tradu (‘Company’, ‘we’) by a third-party provider (‘TFA Global Pte Ltd’). Please be reminded that you are solely responsible for the trading decisions on your account. Any information and/or content is intended entirely for research, educational and informational purposes only and does not constitute investment or consultation advice or investment strategy. The information is not tailored to the investment needs of any specific person and therefore does not involve a consideration of any of the investment objectives, financial situation or needs of any viewer that may receive it. Past performance is not a reliable indicator of future results. Actual results may differ materially from those anticipated in forward-looking or past performance statements. We assume no liability as to the accuracy or completeness of any of the information and/or content provided herein and the Company cannot be held responsible for any omission, mistake nor for any loss or damage including without limitation to any loss of profit which may arise from reliance on any information supplied by TFA Global Pte Ltd.

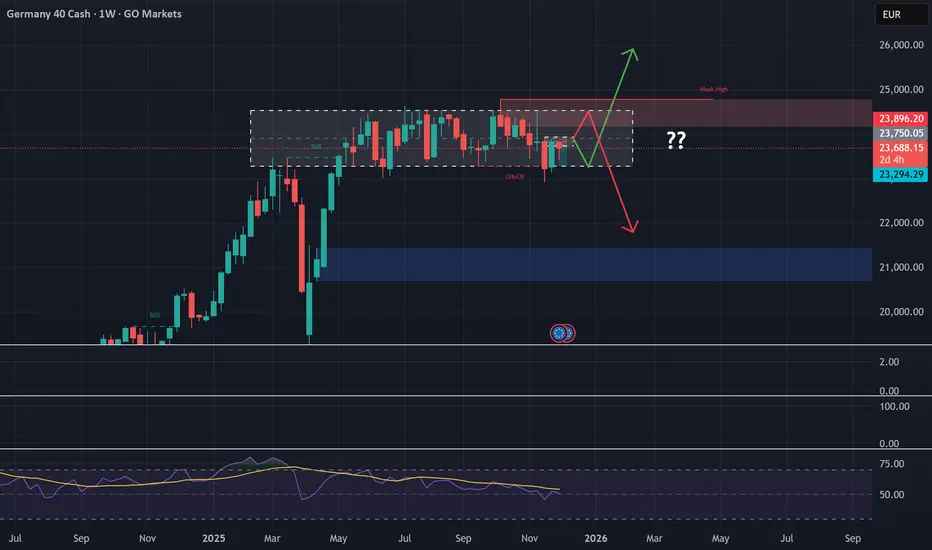
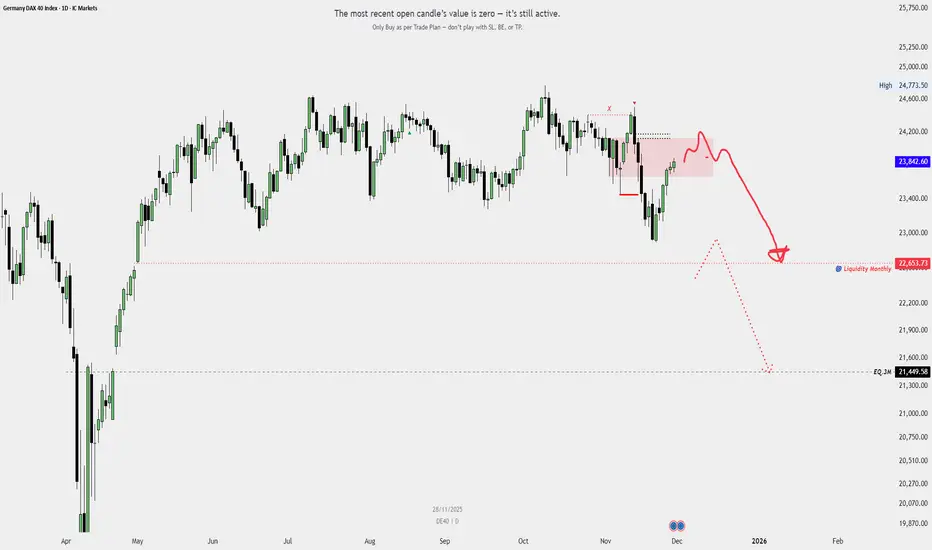
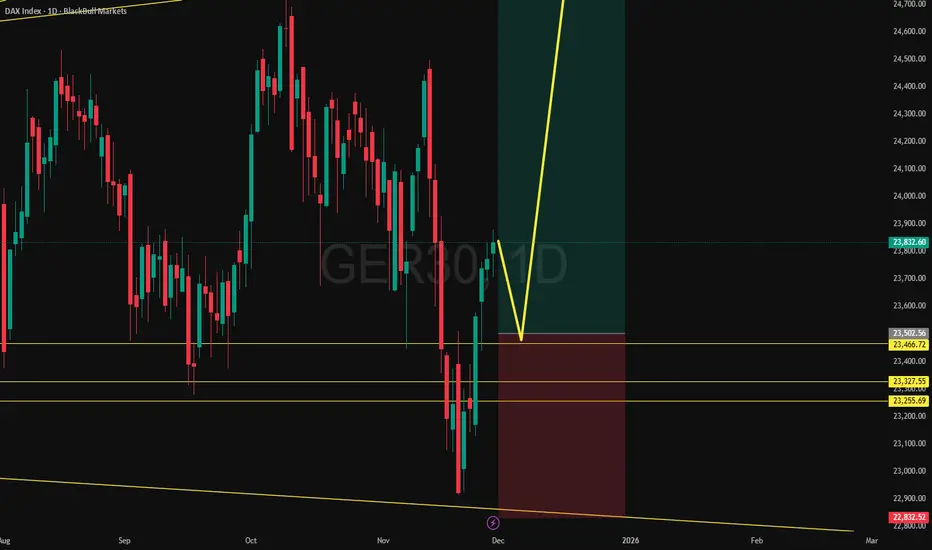
DAX 40 Analysis: The Giant with Feet of ClayCurrent Status (Estimated): ~23,800 - 24,100 points (near the highs, but with declining momentum).
Summary Verdict: Index "Stretched." Ascent driven by global inertia (S&P 500), but hindered by poor domestic fundamentals.
Macro Divergence: The German economy is in a technical recession (manufacturing stalled), but the index is at its highs. This is a divergence that will eventually close (either the economy improves, or the index falls).
The Weight of the Euro: With the Fed cutting rates and the ECB holding steady, the Euro is strengthening (EUR/USD towards 1.16+). A strong Euro is poison for the DAX, which is composed of large exporters (BMW, Siemens, BASF) that earn in Dollars and convert to Euros.
Poor R:R (Risk:Reward): Buying now at the highs offers limited upside potential (the "ceiling" is near) compared to the risk of a correction (the "floor" is far away, towards 23,000).
2. Future Scenarios (What to expect)
Given the mix of American euphoria (which is pulling everything up) and German depression, here are the two most likely scenarios for the coming weeks.
SCENARIO A: The "Bull Trap" (Probability 55%) - TACTICAL SHORT
The Dynamics: The DAX tries to follow the S&P 500 towards new all-time highs (area 24,500 - 24,600) in the wake of optimism for the Fed rate cut on December 10th.
The Trigger: It arrives in that area with low volumes and diverging indicators (RSI H4 decreasing while the price rises).
The Outcome: False breakout (Bull Trap) and rapid rotation downwards as soon as investors realize that the Euro at 1.17 kills Q4 earnings of German companies.
Target: Return towards the key support at 23,000 / 22,950.
SCENARIO B: Lateral "Grind" (Probability 35%) - NO TRADE
The Dynamics: The S&P 500 rises, but the DAX cannot follow it. It remains stuck in a narrow range (23,800 - 24,200).
The Reason: Money flows out of Europe (low growth) to the USA (AI boom + falling rates) or Asia.
Trading: This is the worst scenario for a trader ("meat grinder"). You waste time and pay swaps.
Here are the two setups (one Long, one Short) that might make sense:
🔵 LONG SETUP (Only on collapse)
Where: Area 22,950 - 23,050.
Why: If the price collapses there, it is a technical buying opportunity (technical rebound) regardless of the macro.
Stop Loss: 22,800.
🔴 SHORT SETUP (The preferred one)
Where: Area 24,450 - 24,600 (Double Top / ATH).
Why: Short the extreme resistance with a strong Euro.
Stop Loss: 24,750 (Tight, above the highs).
Target: 23,500.
Logic: Bet on the fact that the real German economy will end up weighing on valuations.
Disclaimer!!! The content of this article is for informational, educational, and entertainment purposes only. It does not constitute financial advice, investment advice, or a recommendation to buy or sell securities, cryptocurrencies, or other financial instruments. The author is not a professional financial advisor. Investing in the financial markets involves high risks, including the possible loss of all capital. Before making any investment decisions, you are strongly advised to do your own research (DYOR) and, if necessary, consult a qualified professional. The author assumes no liability for any loss or damage arising from the use of the information contained in this article.
$DAX Move HigherDAX broke below the trendline on a false breakdown, before a close above the trendline, a re-test and hold. Looking for a move back to the above trendline at 24280 or so.

DAX breakout supported at 23446The DAX remains in a bullish trend, with recent price action showing signs of a breakout within the broader uptrend.
Support Zone: 23446 – a key level from previous consolidation. Price is currently testing or approaching this level.
A bullish rebound from 23446 would confirm ongoing upside momentum, with potential targets at:
23950 – initial resistance
24140 – psychological and structural level
24380 – extended resistance on the longer-term chart
Bearish Scenario:
A confirmed break and daily close below 23446 would weaken the bullish outlook and suggest deeper downside risk toward:
23350 – minor support
23200 – stronger support and potential demand zone
Outlook:
Bullish bias remains intact while the DAX holds above 23446. A sustained break below this level could shift momentum to the downside in the short term.
This communication is for informational purposes only and should not be viewed as any form of recommendation as to a particular course of action or as investment advice. It is not intended as an offer or solicitation for the purchase or sale of any financial instrument or as an official confirmation of any transaction. Opinions, estimates and assumptions expressed herein are made as of the date of this communication and are subject to change without notice. This communication has been prepared based upon information, including market prices, data and other information, believed to be reliable; however, Trade Nation does not warrant its completeness or accuracy. All market prices and market data contained in or attached to this communication are indicative and subject to change without notice.

Dax don't take this trade the previous level was respected as assumed ; so this is the real set up i'm taking , the overall sentiment is bullish .... BUY nOW

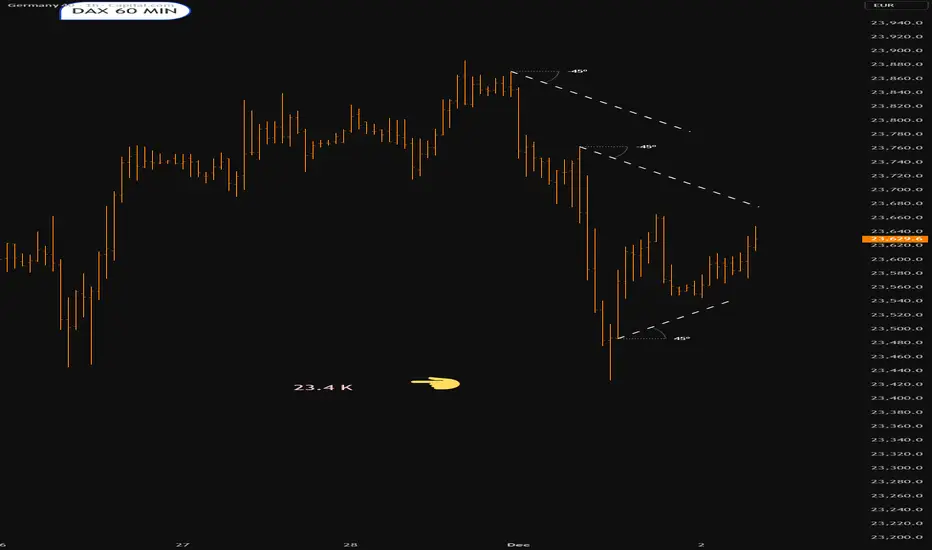
Dax into the open.Tuesday 2nd DecemebrDoes not look happy
Sellers will want to take out 23.4 K
Lets see what happens
Technical Analysis WeeklyGermany 40 is in a neutral range after avoiding a major breakdown, trading at 23,503 near the VWAP of 23,616. RSI at 44.9 indicates indecision. Support is at 22,866, resistance at 24,366.
Wall Street remains bullish but is now in a correction phase, trading at 47,515 above the VWAP at 46,903 but below former highs. RSI at 56.9 suggests a resumption of bullish momentum. Support is at 45,592, resistance at 48,214.
UK 100 continues to trend bullishly but is rebounding inside a correction phase. Price is at 9,707, just above the VWAP of 9,667. RSI at 54.7 reflects neutral momentum. Support is 9,439, with resistance at 9,895.
GBP/USD is in a bearish correction phase - rebounding after a breakdown from its former range, with price at 1.3232 just above VWAP at 1.3155. RSI of 56.2 hints at mild rebound potential. Support is at 1.3043, resistance at 1.3267.
EUR/USD continues within a neutral range, having not taken out significant formers lows, trading at 1.1626 slightly above VWAP of 1.1574. RSI at 58.8 signals modest bullish bias. Support is 1.1497, resistance at 1.1652.
USD/JPY is undergoing a pullback within its bullish trend after testing multi-year highs, trading at 155.12 under the VWAP of 155.50. RSI at 50.8 reflects balanced momentum. Support is at 153.35, resistance at 157.66.
Gold is rallying again after breaking out of a triangle pattern but is still in a correction phase below former highs within its bullish trend, trading at 4,256 above VWAP of 4,117. RSI at 66.3 signals continued strength. Support lies at 3,986 with resistance at 4,256.
Brent Crude remains in a neutral range, having avoided a breakdown below the key 6,000 figure, trading at 6,310 on top of its VWAP of 6,300. RSI at 49.3 indicates balanced conditions. Support is at 6,140, with resistance at 6,481.

DAX CRUSHING IT BUY NOWthis is my humble set up for Dax INDEX for the next week ; the overall sentimebt is bullish , so keep your positions tight ; it's time to make some extra money this week

GER30 H4 | Potential Bullish RiseMomentum: Bullish
Price has bounced from the buy entry, which is acting as pullback support, and is currently trading above the 50% Fibonacci retracement level.
Buy Entry: 23,688.33
Pullback support
Stop Loss: 23,457.40
Strong overlap support
Take Profit: 24,112.40
Pullback resistance
145% Fibonacci extension
High Risk Investment Warning
Stratos Markets Limited (tradu.com ), Stratos Europe Ltd (tradu.com ):
CFDs are complex instruments and come with a high risk of losing money rapidly due to leverage. 70% of retail investor accounts lose money when trading CFDs with this provider. You should consider whether you understand how CFDs work and whether you can afford to take the high risk of losing your money.
Stratos Global LLC (tradu.com ): Losses can exceed deposits.
Please be advised that the information presented on TradingView is provided to Tradu (‘Company’, ‘we’) by a third-party provider (‘TFA Global Pte Ltd’). Please be reminded that you are solely responsible for the trading decisions on your account. Any information and/or content is intended entirely for research, educational and informational purposes only and does not constitute investment or consultation advice or investment strategy. The information is not tailored to the investment needs of any specific person and therefore does not involve a consideration of any of the investment objectives, financial situation or needs of any viewer that may receive it. Past performance is not a reliable indicator of future results. Actual results may differ materially from those anticipated in forward-looking or past performance statements. We assume no liability as to the accuracy or completeness of any of the information and/or content provided herein and the Company cannot be held responsible for any omission, mistake nor for any loss or damage including without limitation to any loss of profit which may arise from reliance on any information supplied by TFA Global Pte Ltd.

Germany 40 index Dax Swept High,s Running Low,sGermany 40 index Dax Swept High,s Running Low,s
Market structure shifted completely bearish.
once in lower time frame Mss happend i will open short position till Monyjly liqudity,
potential Much Lower.
GER SELLLow probability high risk sells. Risk reasonably. Price is coming from an Imbalance after sweeping liq so sells is low probability for now.

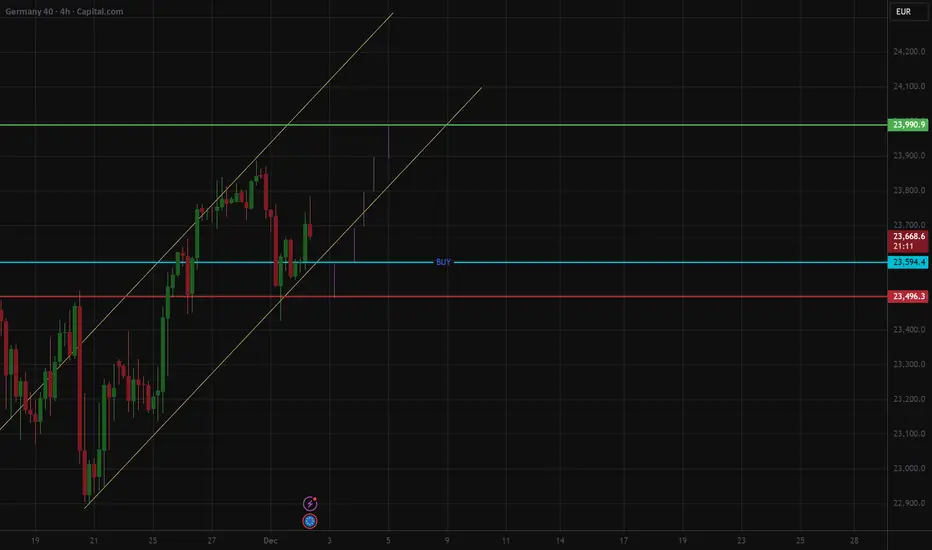
Long order DAX on pullback RR1:4 DAX in a bull channel on the 4 H chart. The order is at the "BUY" line, and the risk is 100 points in the dax, with a target of 400 points. As always with the larger swing trades, be prepared to buy MORE if the trade is working in your favor and let it hit your stop loss if it doesn't.

DAX.Chart patternThat looks to be the vhart pattern we are trading
Trying to break that downtrend .Plenty of overhead resistance
lets see what happens

DAX Expanding Wedge Long Setup — Bottom Retest + False BreakDAX is trading inside a broadening/expanding wedge within a larger uptrend. Price has recently swept the lower boundary and faked below a short-term trendline, showing signs of a downside trap.
DAX CALL FOR BUYGermany is showing a strong resistence with a solid economy and industry , making this year a year of resistence and potetil loss , but the comeback is hard ; take you position once the price get out of the zone where buyer are waiting

Technical Analysis WeeklyGermany 40 has continued higher over the past week but remains inside its broader range, trading at 24,075 above the VWAP of 23,499. RSI at 57.8 indicates increasing momentum. Support is found at 22,855, with resistance matching the current high at 24,075.
Wall Street continues in a bullish trend and is retesting all time highs, in what could see the sideways correction continue or a breakout. Price is trading at 47,947 above its VWAP of 46,853. RSI at 60.6 reflects growing bullish sentiment. Support is at 45,454, with resistance at 48,253.
UK 100 remains in a bullish trend but is still in a corrective phase. It’s trading at 9,659, just above its VWAP of 9,622. RSI at 49.6 suggests neutral momentum. Support lies at 9,478, while resistance is at 9,757.
GBP/USD continues its near term rebound but the bigger picture is one of a down-sloping price range. It trades at 1.3317, well above the VWAP of 1.3203. The RSI of 61.3 supports the upward momentum. Support sits at 1.3018, and resistance is at 1.3388.
EUR/USD sits at the top of its short term range, in the middle of its longer term sideways range. It trades at 1.1650, above the VWAP at 1.1592. The RSI at 60.0 confirms strengthening momentum. Support is at 1.1500, with resistance at 1.1693.
USD/JPY remains in a bullish trend but is undergoing a correction. It trades at 155.33, slightly under the VWAP at 156.88. The RSI at 54.1 shows moderate momentum. Support is at 154.38 and resistance at 157.28.
Gold has tracked sideways since breaking back over 4200, with upside momentum supported by an uptrend line, currently trading at 4,204 above its VWAP of 4,146. RSI at 60.2 indicates continued buying strength. Support is at 4,020, resistance at 4,272.
Brent Crude is still trading sideways with a slight bias lower. Price is 6,303, sitting just under the VWAP of 6,436. RSI at 48.9 shows muted enthusiasm. Support is at 6,153 and resistance at 6,436.
Germany 40 (DAX) – Daily TF Sell Limit at ResistanceGermany 40 (DAX) – Daily TF Sell Limit at Resistance
Germany 40 has been moving in a broader upward channel but is now approaching a key daily resistance zone where price has previously rejected.
Momentum on the recent rally is slowing, showing signs of exhaustion near resistance.
Daily Resistance Zone: A strong supply area where price reversed multiple times.
Sell Limit Area: Positioned slightly below the main resistance to catch early rejection.
Stop Loss: Above the resistance / above previous daily swing high.


Bullish bounce off?DAX40 has bounced off the pivot, which is a pullback support, and could rise to the 1st resistance, which acts as a pullback resistance.
Pivot: 23,488.29
1st Support: 23,293.56
1st Resistance: 23,956.58
Disclaimer:
The opinions given above constitute general market commentary and do not constitute the opinion or advice of IC Markets or any form of personal or investment advice.
Any opinions, news, research, analyses, prices, other information, or links to third-party sites contained on this website are provided on an "as-is" basis, are intended to be informative only, and are not advice, a recommendation, research, a record of our trading prices, an offer of, or solicitation for, a transaction in any financial instrument and thus should not be treated as such. The information provided does not involve any specific investment objectives, financial situation, or needs of any specific person who may receive it. Please be aware that past performance is not a reliable indicator of future performance and/or results. Past performance or forward-looking scenarios based upon the reasonable beliefs of the third-party provider are not a guarantee of future performance. Actual results may differ materially from those anticipated in forward-looking or past performance statements. IC Markets makes no representation or warranty and assumes no liability as to the accuracy or completeness of the information provided, nor any loss arising from any investment based on a recommendation, forecast, or any information supplied by any third party.

Bullish rise?GER30 is falling towards the support level, which is a pullback support that aligns with the 23.6% Fibonacci retracement and could bounce from this level to our take profit.
Entry: 23,644.94
Why we like it:
There is pullback support at the 23.6% Fibonacci retracement.
Stop loss: 23,351
Why we like it:
There is a pullback support that aligns with the 50% Fibonacci retracement.
Take profit: 24,369.29
Why we like it:
There is a pullback resistance level.
Enjoying your TradingView experience? Review us!
Please be advised that the information presented on TradingView is provided to Vantage (‘Vantage Global Limited’, ‘we’) by a third-party provider (‘Everest Fortune Group’). Please be reminded that you are solely responsible for the trading decisions on your account. There is a very high degree of risk involved in trading. Any information and/or content is intended entirely for research, educational and informational purposes only and does not constitute investment or consultation advice or investment strategy. The information is not tailored to the investment needs of any specific person and therefore does not involve a consideration of any of the investment objectives, financial situation or needs of any viewer that may receive it. Kindly also note that past performance is not a reliable indicator of future results. Actual results may differ materially from those anticipated in forward-looking or past performance statements. We assume no liability as to the accuracy or completeness of any of the information and/or content provided herein and the Company cannot be held responsible for any omission, mistake nor for any loss or damage including without limitation to any loss of profit which may arise from reliance on any information supplied by Everest Fortune Group.

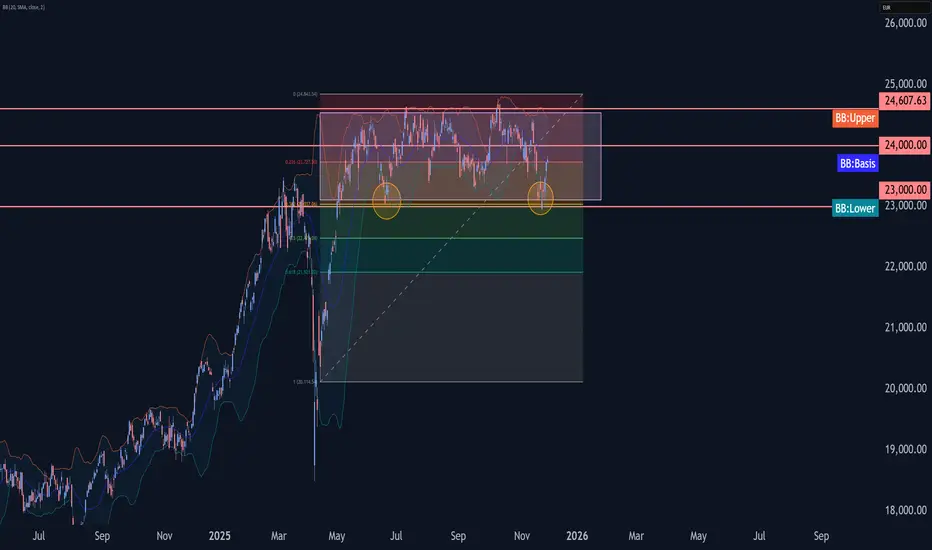
DAX Wave Analysis – 27 November 2025- DAX reversed from support area
- Likely to rise to resistance level 24000.00
DAX index recently reversed from support area between the support level 23000.00 (lower border of the sideways price range inside which the price has been moving from June) and the lower daily Bollinger Band.
The upward reversal from this support area stopped the previous minor impulse wave C of the intermediate ABC correction (4) from July.
Given the clear daily uptrend, DAX index can be expected to rise to the next resistance level 24000.00.