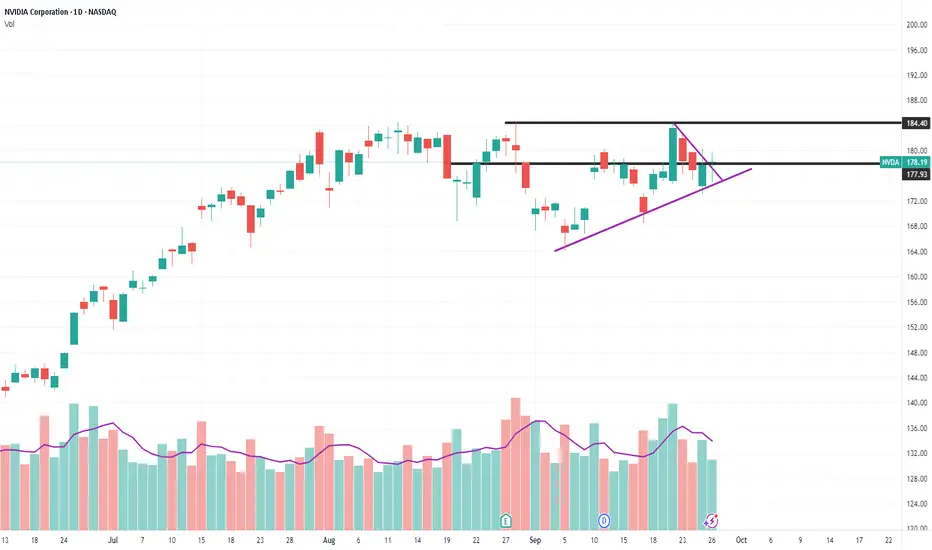
NVDA: A new ATH, at what cost?As NVDA climbs to new ATH’s, it still struggles to break through resistance. it’s my belief that we revisit 179 before seeing 200. thoughts are appreciated, thanks.
NVD trade ideas
Tops in? or 1 more high left...Yea I think this may have topped or it squeezes out one more cheeky high - regardless it's going to correct hard and fast - expect it to -50% gl.
NVDA – Coiling Tight for a Big Move on Gamma Levels . Sep 29NVDA – Coiling Tight for a Big Move as Gamma Levels Draw the Battle Lines ⚡️
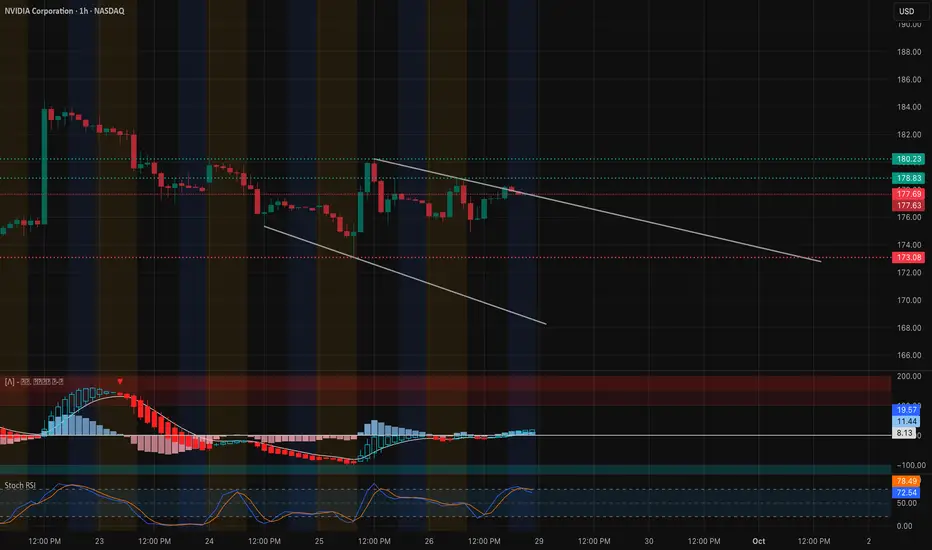
1-Hour Technical Outlook
NVIDIA has been grinding inside a narrowing descending channel after its recent selloff, with intraday price now stabilizing around $177–$178. A series of higher lows over the last two sessions hint at basing, but the short-term downtrend line from the $185 zone still caps upside. MACD histogram just turned positive and the Stoch RSI is pointing higher, signaling an early shift in momentum.
Immediate resistance sits at $180.2, followed by the heavy supply zone between $182.5 and $185. Key support levels are $175 (short-term pivot) and $172–$170 (structural demand).
Gamma Exposure (GEX) Confirmation
The options landscape reinforces these technical pivots:
* Major Call Wall / Max positive GEX is stacked at $185, with ~45% of call positioning concentrated there.
* Secondary call concentration: $182.5 (~39% call wall).
* Strong put support: $172.5 and $170, matching the lower trend channel and recent lows.
This setup suggests a gamma squeeze could ignite if NVDA breaks and holds above $180.2, where dealer hedging may accelerate upside toward $182.5–$185. Conversely, a loss of $175 would expose $172 and potentially $170 as downside magnets.
Trade Ideas & Option Plays for This Week
* Bullish Setup: Long above $180.2 with targets at $182.5 and $185. Ideal options: 1-week 180 or 182.5 calls, or 180/185 debit spreads to lower premium.
* Bearish Scenario: Breakdown below $175 opens room to $172 and $170. Traders can look at short-dated puts or vertical spreads such as 175/170.
* With IVR around 5.3 and IVx near 39, premiums are still modest—an advantage for debit spreads.
My Take:
NVDA is in a classic coiling pattern. Momentum oscillators are leaning bullish, but price must clear $180.2 to validate a trend reversal. The gamma map perfectly matches these breakout levels, giving confidence to the setup. Keep a tight stop below $175 if going long, and be ready to flip short if sellers reclaim control.
Disclaimer: This analysis is for educational purposes only and does not constitute financial advice. Always do your own research and manage risk before trading.
NVDA Is Setup to Break New All-time Highs2025-09-26: NVDA Bullish Setup is Ready
1). Higher Lows Thursday ($173.13), Friday ($174.93). Will be perfect setup if next Monday close higher than $174.93.
2). Today vs Startup date Volume 23% Decrease 09-18: 191.76M vs 09-26 148.47M
3). Support Doji (Lower wig longer)
4). Close above all Moving Averages
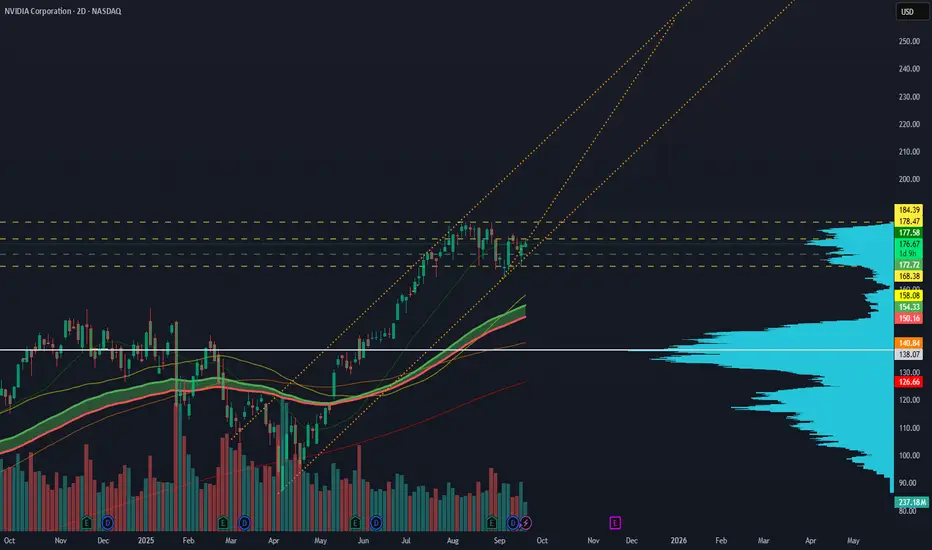
Bullish Momentum Builds as Nvidia Exits Consolidation Phase🚀 Nvidia Nears Breakout: Strong uptrend with volume profile support. Consolidation phase close to completion. Entry $172.95 | SL $167 | TP $255.65 → Attractive risk/reward setup for continuation higher. Let the bulls do their work — update to follow.
⚠️ Not financial advice.
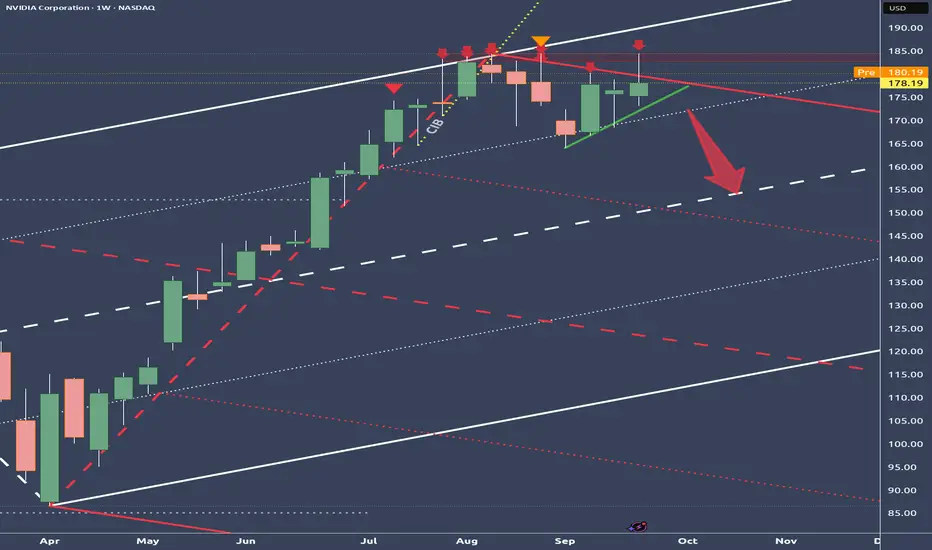
NVIDIA – Enormous Pressure After Reaching the Stretch LevelBetween July 31 and August 13, price kept nagging at the white U-MLH,
but there wasn’t enough strength to break through.
From there, price began to drift lower, pressing against the red U-MLH.
The close last Friday failed to break below the red U-MLH –
a clear sign of weakness!
If the green mini-trendline gives way and the white ¼-Line moves above price as well,
NVDA could be ripe for a short setup.
Let’s stalk the trade.
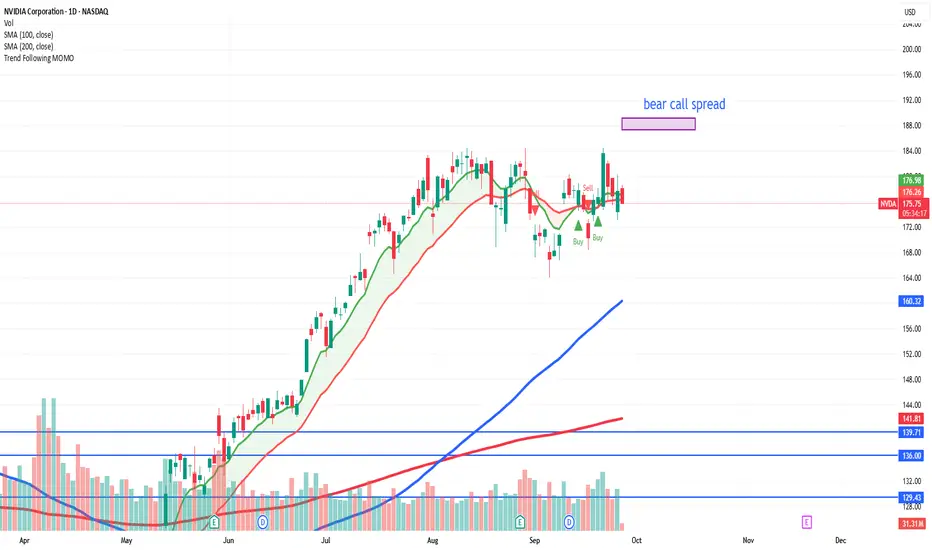
nvda bcs looks like exhaustion buying 4 days ago. Expecting NVDA to rest and consolidate with the market. Likely be able to btc this position for a small win in a week
if not, sideways action or bear action will turn this into a winner
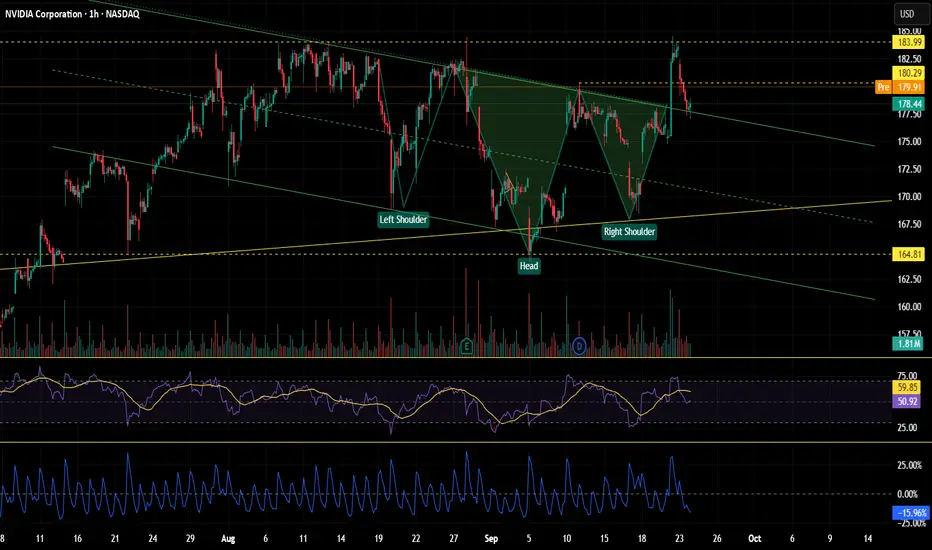
H&S on NVDA pullback immenentShort post:
Drawdown to 124$ levels is most likely and probably happens by end of Oct.

NVDA buy order
Price sold off at 178.04 the broke out showing that price is bullish the next time price is above 178.04
We see bullish structure (higher highs higher lows)
We see the textbook price action
Indication
Correction
Continuation
Good RR (1:3)
We also have Nvidia wanting to invest $100B into Chatgpt (Bit of fundamentals for ya)

$NVDA İS BREAKİNG UPNASDAQ:NVDA After breaking downtrend line sometimes it is like a default move the retest previous downtrend. expecting to get more strengt in this area and test 184.50 ATH. This setup is one of my farovite one.

$NVDA Cracks were already showing.NASDAQ:NVDA Cracks were already showing.
Momentum stalled, buyers hesitated, and the tape began to lean heavy.
That’s the trap.
Structure tells a different story.
When lower highs started stacking, the short wasn’t a guess — it was the only logical play.
The edge comes from seeing what others ignore:
That hesitation is often the first domino.
That failed breakouts fuel the breakdowns.
By the time the flush came, it looked obvious.
But the decision was made long before — risk mapped, bias clear, execution ready.
Most chase the move.
The prepared step into it.

NVDA NVIDIA Corporation Options Ahead of EarningsIf you haven`t bought NVDA before the previous earnings:
Now analyzing the options chain and the chart patterns of NVDA NVIDIA Corporation prior to the earnings report this week,
I would consider purchasing the 150usd strike price Calls with
an expiration date of 2025-9-19,
for a premium of approximately $13.35.
If these options prove to be profitable prior to the earnings release, I would sell at least half of them.

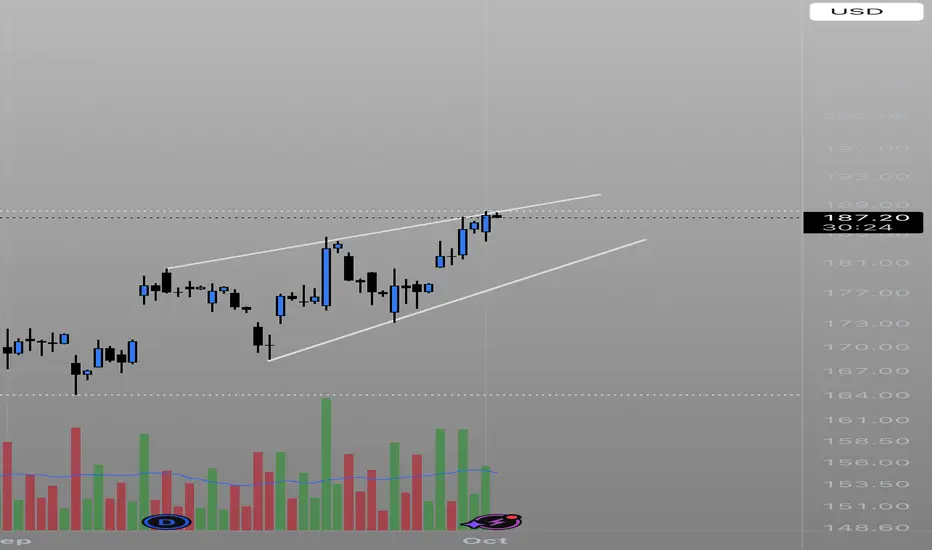
bull flag and inverse head and shoulder breakout retestOn monday 22sept we broke the bullflag/ descending channel and also inverse head and shoulders on the 4hour chart with high volume.
Yesterday we went for a retest of the breakout as expected to 177.6
the 4hours candle closed as a bullish hammer candle.
Todays expectation is nvidia to retest or break its ATH at 184.
If we break 184 today we are lookig at the target of the inverse head and shoulder by end of week wich is 195.
if you look at the rsi ,the rsi is not overbought anymore and made a higher high so no signs of the bears.
NVDA LONG TRADING PLANDivergence on 1H RSI. He is Making a Support there. So there is o much chance it will brake the HH. But i am my canceling my Main order. i will wait if at my Entry there is Divergence or any news then i will Short there. Question me i will answer.

NVIDIA’s Decisive Battle at the $185 Resistance🔹 Short-Term Outlook (1–3 Weeks)
Current Situation:
NVIDIA (NVDA) is trading around $183.6, right below the critical $185 resistance—a level that has repeatedly capped the stock’s rallies.
Momentum & Pattern:
The price has reclaimed the 50-day moving average ($175.9) with a strong bullish candle, signaling renewed buying interest.
Bullish Scenario:
If NVDA breaks and holds above $185:
🎯 Target 1: $195
🎯 Target 2: $205
Bearish Scenario:
If the stock fails to break $185 and closes below $175:
❌ Short-Term Stop Loss: below $175
🎯 Downside Target: $165
🔹 Long-Term Outlook (2–6 Months)
Overall Trend:
The medium-term trend remains bullish, and a decisive breakout above $185 could ignite a new rally.
Bullish Scenario:
🎯 Medium-Term Target: $220
🎯 Long-Term Target: $250
Bearish Scenario:
If the stock loses the $160 support:
❌ Long-Term Stop Loss: below $160
🎯 Downside Target: $140
✅ Summary:
NVDA stands at a pivotal level. A breakout above $185 could open the door to $200 and higher, while rejection at this level risks a pullback toward $165.

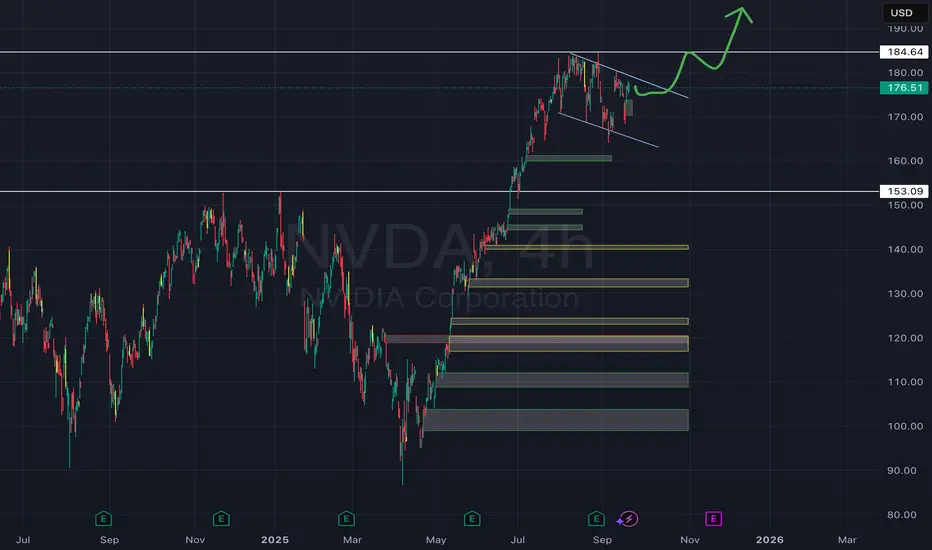
Higher 4 longer.Bull flag here on the longer time framez should play out. Maybe chop sidewayz then push back to ATH. AI nerrative still strong n no reason 2 go heavy shortin this scam. If u short u better take ur money on those small downturnz cause trust me, they dont last!
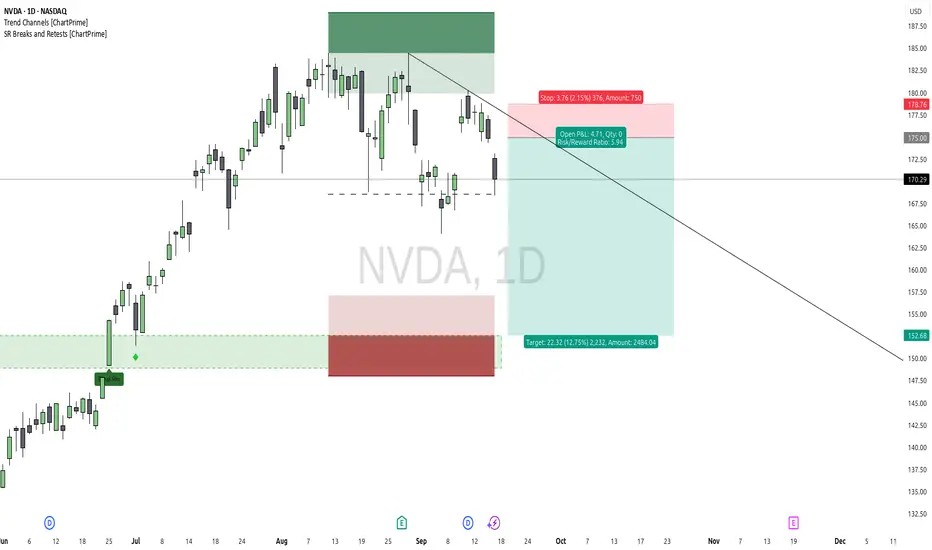
$NVDA: The River Changes Course - A Mean Reversion IdeaThe Technical Landscape
Our prior long setup on NASDAQ:NVDA was invalidated, providing us with the invaluable information that the bullish momentum has stalled. Following the Fed's announcement, the market's breath has changed. We now see a potential downtrend forming on the daily chart, with price creating lower highs and respecting a new descending trendline. The bears, who have been slumbering, appear to be waking up.
Instead of fighting this new current, we look to flow with it. The thesis is no longer about bullish continuation, but about a potential reversion to the mean. Price has a memory, and we are targeting a return to the scene of the previous major breakout, the demand zone around the $152 level. This is simply one piece of the puzzle, viewed without bias or ego.
The Philosophy - Listening When The Market Speaks
The trend is your friend, until it isn't. Our job is not to predict when the friendship will end, but to recognize when the dynamic has changed and act accordingly.
Our previous attempt at a long wasn't a failure; it was the market telling us, at a very small cost, that our hypothesis was incorrect for the current conditions. A limitless trader embraces this information with gratitude, for it protects us from the much greater cost of being stubborn. We are not "flipping" from bull to bear out of emotion. We are simply listening, adapting, and aligning with the price action that is presenting itself right now. Don't be a salmon, stubbornly fighting a new and powerful current. A limitless trader considers all outcomes, and right now, the path of least resistance appears to be pointing down.
An Illustrative Setup
Style: Short / Mean Reversion
Entry: An area of confluence around $175, near the descending trendline resistance.
Stop Loss: A defined stop above recent highs and trendline resistance at $178.75. If price breaks this level, our bearish thesis is invalidated.
Take Profit: Targeting the area of prior breakout, around $152.50.
Risk/Reward: Approximately 1 : 5.9
A safer, more conservative entry could be sought on a break and hold below the $168 support level, but always remember to manage your own risk based on your personal strategy.
Disclaimer: This is not financial advice. It is for educational and informational purposes only. Please conduct your own research and manage your risk accordingly.
Nvidia and OpenAI Announce Partnership, NVDA Shares SurgeNvidia and OpenAI Announce Partnership, NVDA Shares Surge
Yesterday it was revealed that leading chipmaker Nvidia and leading artificial intelligence research laboratory OpenAI have announced a strategic partnership, under which Nvidia will invest $100 billion in OpenAI.
A network of data centres will also be created to train and operate the most advanced artificial intelligence models:
→ the network will be based on Nvidia’s next-generation platform, Vera Rubin;
→ the network’s total capacity is unprecedented, reaching 10 gigawatts;
→ the first phase of the project is expected to launch in the second half of 2026.
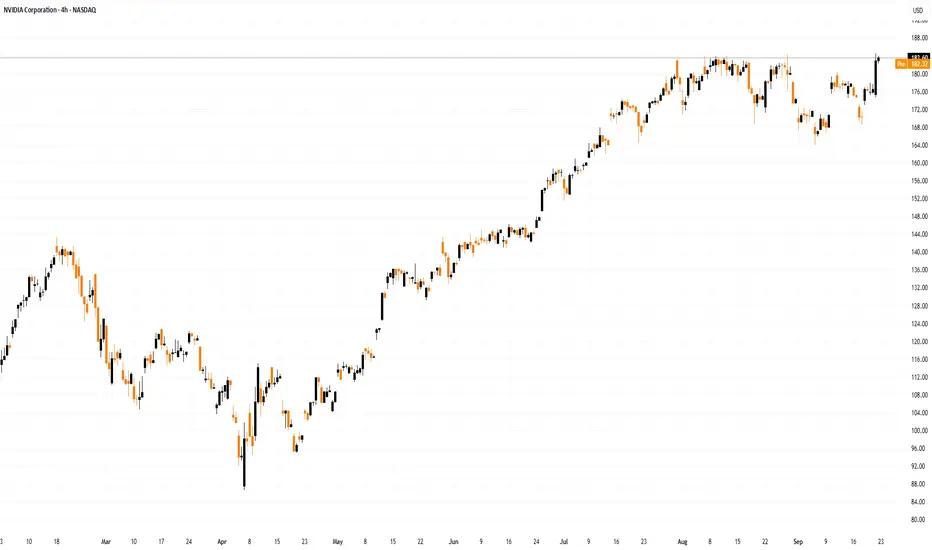
Nvidia (NVDA) shares reacted sharply to the news. During Monday’s trading, 22 September, the company’s stock price jumped by roughly 4%, climbing at yesterday’s high above $184.30 (marking a new all-time record, as shown on the chart). The chipmaker’s market capitalisation closed in on $4.5 trillion, cementing its status as the most valuable company in the world.
Technical Analysis of Nvidia (NVDA) Chart
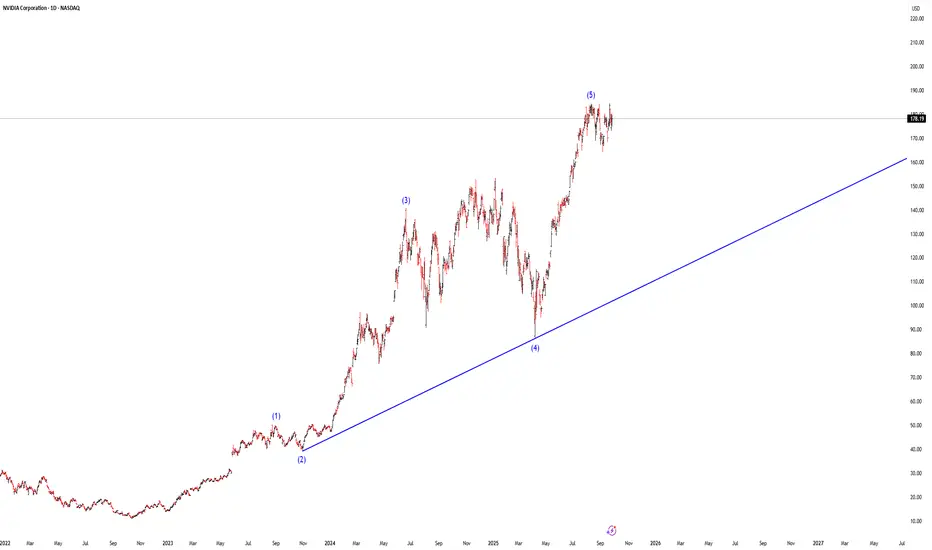
Previously, in our 1 September analysis of NVDA, we:
→ plotted an ascending channel describing NVDA’s price movements following the bullish impulse at the end of June;
→ noted unsuccessful attempts by the bulls to break resistance at $183, which provided grounds to view the chart in the context of a Triple Top pattern (1-2-3);
→ assumed that the bears were exerting pressure on an overvalued stock and considered a correction scenario.
Since then, the Nvidia stock price corrected to $165, from where it resumed its upward trend (shown with a broken arrow).
The new data provide grounds to:
→ expand the channel (shown in blue) without changing its slope, adding the QH and QL lines to divide the wider channel into quarters;
→ plot the trajectory of the correction (in red).
Within this context, it is reasonable to assume that:
→ the stock price of NVDA found support at the QL line and moved up towards the midline;
→ the red lines form a Bullish Flag pattern;
→ yesterday’s rise broke out of this corrective pattern, with the bulls attempting to resume the upward trend, though the $183 level still provides resistance.
It is not excluded that the strong fundamental background, the development of AI technologies, and the supportive driver of the Fed’s rate cut may ultimately enable the bulls to overcome the $183 level, paving the way for NVDA’s share price to approach the psychological $200 mark.
This article represents the opinion of the Companies operating under the FXOpen brand only. It is not to be construed as an offer, solicitation, or recommendation with respect to products and services provided by the Companies operating under the FXOpen brand, nor is it to be considered financial advice.
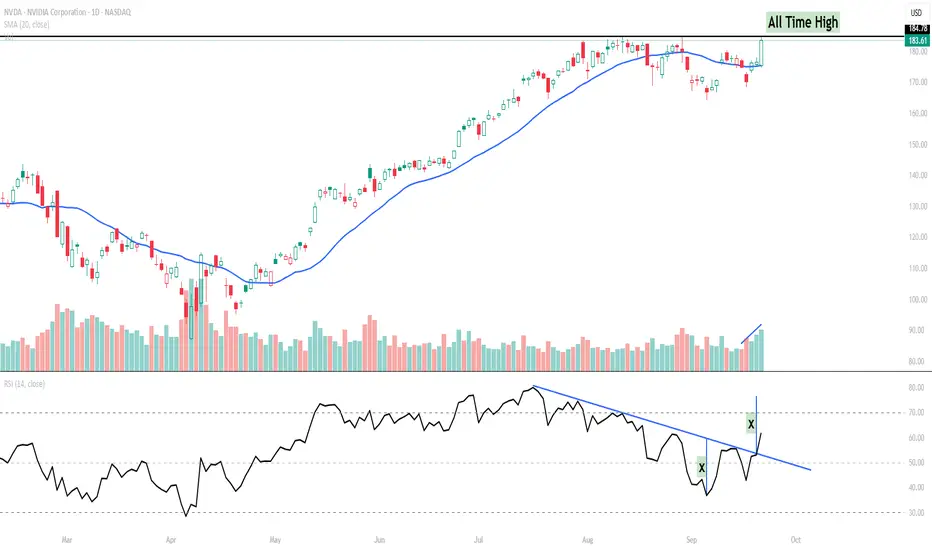
NVIDIA (NVDA) – RSI Trendline Breakout Signals Momentum Shift NVIDIA has staged a sharp move higher, reclaiming momentum after weeks of sideways-to-lower action. What makes this setup notable is not just the price, but the RSI trendline breakout.
Key Points:
RSI Trendline Breakout: The RSI broke above a descending trendline, suggesting momentum is shifting back in favour of buyers.
Volume Confirmation: The breakout coincided with a strong volume spike – often an early tell that institutions are stepping in.
Price Action: Price is now retesting the all-time high zone (~$184–185). A sustained close above this level could open the door for further upside.
Short-Term View: As long as NVDA holds above the $175–177 support zone, the bias remains bullish with potential for acceleration if RSI pushes toward the overbought zone.
Watchlist Levels:
Upside breakout trigger: $185+ (new all-time high)
Immediate support: $175
Momentum invalidation: Below $175
This is a classic case of how RSI trendline analysis can provide an early signal, often before price fully confirms the breakout.
$NVDA 15-Min: The God Candle That Spoke Loudest NASDAQ:NVDA exploded on the 15-minute chart today.
One bar, full conviction — the type of move traders call a god candle.
But here’s the truth: it isn’t about chasing candles.
It’s about having a process that makes you ready when they appear.
The groundwork is done before the bell.
Pre-market calculations define the risk, filter the noise, and set the stage for the opening drive.
When the signal aligns, you don’t predict — you execute.
Most of the time, the market is noise.
Occasionally, it speaks clearly.
Your job is to cut the losers fast, let the winners breathe, and keep showing up until the edge reveals itself.

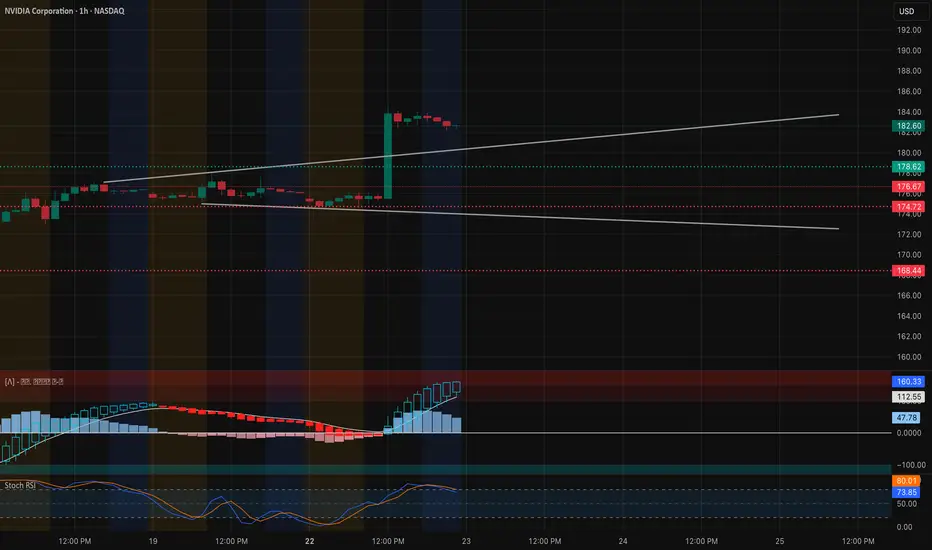
NVDA: Power Gap Push — Can Bulls Hold the 182 Zone? Sep 23Price Action & Setup (1-Hour Chart)
NVDA ripped early in today’s session, blasting through the mid-170s base and tagging 182–184 before cooling off. That surge printed a strong hourly impulse candle and left a shallow flag of lower highs, which often sets up the next leg if demand holds. Immediate intraday support sits around 178.6 and the breakout shelf at 176.6. Below that, 174.7 is a must-defend zone for bulls.
Momentum Check
MACD on the 1-hour flipped positive with expanding histogram but is flattening, signaling short-term digestion. Stoch RSI is still hot (near 80+), so a brief pullback to reset isn’t out of the question. Volume on the breakout was convincing, showing real participation, but follow-through volume on the flag is key.
GEX (Options Flow) Confluence
Gamma exposure backs the bullish case if 182.5 holds:
* Highest positive GEX / Call resistance: near 182.5
* 2nd Call Wall: ~185 (80% call concentration)
* 3rd Call Wall: ~190
* Put defense: 172.5 and 168.4
The dense call walls above mean that if NVDA stays pinned over 182.5, market makers may have to keep hedging upward, opening room toward 185 then possibly 190. A slip under 178–176 would instead drag toward the 172.5 put magnet.
Trading Plan
* Aggressive bull scalp: eye a break & hold above 182.6 → target 185 with tight stop under 180.8.
* Conservative entry: wait for a retest of 178.5–176.5 and a clean bounce before joining.
* Bearish hedge: if 176.5 fails on strong volume, consider a quick put play toward 172.5.
Option Angle
Calls around 182.5–185 strike for this week stay attractive for momentum traders if NVDA grinds above 182.5. For protection or a counter-move, short-dated puts near 172.5 can work if breakdown triggers.
Bottom Line
Bulls control momentum as long as NVDA holds 178–176. A decisive hourly close over 182.5 could spark a gamma-driven push toward 185–190. Lose 176.5 and the party cools fast.
Disclaimer: This is for educational discussion only and not financial advice. Always do your own research and manage risk.
Introduction to Time Zone Arbitrage in Global Markets1. Understanding Arbitrage in Financial Markets
At its core, arbitrage is the practice of exploiting price discrepancies of the same asset across different markets or forms to earn risk-free profit. This fundamental concept underpins much of modern financial trading. In theory, if a stock, currency, commodity, or derivative is priced differently in two markets, a trader can simultaneously buy low in one market and sell high in another, pocketing the difference.
Traditional arbitrage opportunities are rare and fleeting, especially in highly liquid and technologically advanced markets. With the advent of electronic trading, algorithmic strategies, and high-frequency trading, the speed at which these discrepancies are corrected has accelerated dramatically.
Time zone arbitrage emerges as a special form of arbitrage, where the temporal differences between markets become the primary source of exploitable inefficiencies. The financial world is never closed: while one market sleeps, another operates, creating windows for traders to capitalize on lagging price reactions.
2. Global Markets and Time Zones
Financial markets operate within strict local hours. For example:
New York Stock Exchange (NYSE): 9:30 AM – 4:00 PM EST
London Stock Exchange (LSE): 8:00 AM – 4:30 PM GMT
Tokyo Stock Exchange (TSE): 9:00 AM – 3:00 PM JST
These schedules create overlapping periods—for instance, NYSE and LSE overlap between 8:00 AM and 11:30 AM EST—where liquidity and volatility peak. However, outside these overlaps, markets function independently, and information from one market may not immediately influence another due to operational hours.
Time zone arbitrage exploits these gaps. For instance, significant economic data released in the U.S. after the Asian markets close can create arbitrage opportunities for traders when Asian markets reopen the next day. Essentially, traders are leveraging information delays caused by non-synchronous trading hours.
3. Mechanisms of Time Zone Arbitrage
Time zone arbitrage typically involves three major mechanisms:
Price Discrepancy Exploitation:
When an asset trades in multiple markets, its price may diverge temporarily due to the staggered opening hours. For example, a stock listed on both NYSE and LSE might react to corporate news at different times. A trader can buy in the lagging market and sell in the one where the news impact has already been reflected.
Currency Movements:
Forex markets operate 24/5, but liquidity and volatility vary by time zone. Economic announcements from one country may cause currency pairs to move in one region before others react. Traders who monitor these shifts can execute trades across regions to capture price differences.
Futures and Derivatives Arbitrage:
Futures and derivatives tied to underlying assets in different time zones can experience lagged reactions. For example, S&P 500 futures traded in Singapore may temporarily misprice relative to the U.S. cash market during Asian hours. Arbitrageurs can exploit these short-term inefficiencies.
4. Drivers of Time Zone Arbitrage Opportunities
Several factors contribute to the emergence of time zone arbitrage opportunities:
Information Asymmetry:
Not all markets receive or process information simultaneously. Corporate earnings announcements, economic data releases, or geopolitical events may affect markets differently depending on their opening hours.
Liquidity Gaps:
Markets in non-overlapping time zones may have lower trading volumes, causing temporary price inefficiencies. These liquidity gaps are prime targets for arbitrage strategies.
Currency and Macro-Economic Events:
Global macroeconomic releases—like U.S. Non-Farm Payrolls or European Central Bank announcements—impact multiple markets. Since these announcements occur during specific time zones, traders in other regions may act ahead of local market participants.
Technological Differences:
Not all markets are equally automated. While developed markets adjust quickly due to algorithmic trading, emerging markets may show delayed price reactions, enhancing arbitrage potential.
5. Examples of Time Zone Arbitrage
5.1 Forex Market
A classic example is the USD/JPY pair. Suppose a major U.S. economic report releases at 8:30 AM EST. Tokyo traders may not react until the TSE opens at 9:00 AM JST, creating a brief window where the currency pair’s price is misaligned with the news. Arbitrageurs can profit by executing trades between London, Tokyo, and New York markets.
5.2 Stock Market Cross-Listings
Many multinational companies list their shares in multiple exchanges. For example, HSBC trades in London, Hong Kong, and New York. If news affects the Hong Kong market during its daytime, traders can exploit the lag in New York’s reaction to the same news due to time differences.
5.3 Commodities Futures
Consider crude oil futures, which trade in both the CME in the U.S. and the Intercontinental Exchange (ICE) in London. A geopolitical event affecting oil supply may influence ICE prices during European hours, but CME futures may take time to adjust until New York opens, offering arbitrage potential.
6. Tools and Techniques
Modern time zone arbitrage relies heavily on technology. Key tools include:
Algorithmic Trading Systems:
These monitor multiple markets simultaneously, identify mispricings, and execute trades in milliseconds.
High-Frequency Trading (HFT):
Leveraging microsecond speed, HFT firms can capitalize on arbitrage opportunities across time zones before others detect them.
Data Feeds and News Analytics:
Real-time economic and corporate news feeds, combined with AI-powered sentiment analysis, allow traders to anticipate cross-market price movements.
Cross-Market Surveillance:
Continuous monitoring of correlated instruments across regions ensures timely identification of exploitable discrepancies.
7. Risks and Constraints
While time zone arbitrage is theoretically low-risk, several practical challenges exist:
Execution Risk:
Delays in order execution can turn profitable trades into losses.
Transaction Costs:
Spreads, commissions, and fees may erode arbitrage profits, especially in lower-liquidity markets.
Market Volatility:
Unexpected price swings due to global events may render arbitrage positions unprofitable.
Regulatory Barriers:
Some jurisdictions impose restrictions on cross-border trading, capital flows, or short-selling, limiting arbitrage potential.
Technological Risks:
Reliance on connectivity, data feeds, and trading algorithms exposes traders to system failures or cyber risks.
8. Strategies for Time Zone Arbitrage
Successful traders use a mix of strategies:
Cross-Exchange Arbitrage: Exploiting price differences for the same security on multiple exchanges.
Statistical Arbitrage: Using historical correlations and statistical models to predict and trade mispricings.
Latency Arbitrage: Capitalizing on delays in data transmission between markets.
Macro-Event Arbitrage: Reacting to economic, political, or corporate events affecting global markets asynchronously.
9. Market Participants
Time zone arbitrage is primarily the domain of:
Institutional Traders: Hedge funds and proprietary trading desks dominate this space due to the scale and technology required.
High-Frequency Traders: Specialize in exploiting microsecond-level price discrepancies.
Global Asset Managers: Engage in cross-market hedging and arbitrage as part of portfolio optimization.
Retail Traders: Increasingly accessing time zone arbitrage opportunities through online platforms and ETFs, though on a smaller scale.
10. Broader Implications for Global Markets
Time zone arbitrage plays a vital role in market efficiency:
Price Discovery: Arbitrage helps synchronize prices across markets, improving transparency.
Liquidity Distribution: Facilitates smoother capital flows between regions.
Integration of Emerging Markets: Encourages alignment with global market trends.
Technological Advancements: Drives innovation in trading systems, data analytics, and risk management.
However, it can also introduce systemic risks. Over-reliance on algorithms or HFT in multiple time zones may amplify volatility during unexpected events, as seen in global “flash crashes.”
11. The Future of Time Zone Arbitrage
The evolution of global markets suggests that time zone arbitrage will continue to grow in complexity:
24/7 Markets: Cryptocurrency and digital asset markets operate round-the-clock, reducing traditional time gaps but creating new cross-exchange arbitrage opportunities.
AI and Machine Learning: Predictive models can detect emerging arbitrage opportunities faster than human traders.
Global Market Integration: As emerging markets align with major exchanges, arbitrage windows may shrink, but sophisticated strategies will continue to exploit subtler inefficiencies.
Regulatory Evolution: Harmonization of cross-border trading rules may reduce some arbitrage opportunities but also create standardized pathways for institutional strategies.
12. Conclusion
Time zone arbitrage is a sophisticated yet fundamental aspect of modern financial markets. By leveraging temporal gaps between global markets, traders can exploit price inefficiencies for profit. Its successful execution requires advanced technology, rapid decision-making, deep market knowledge, and careful risk management.
While it enhances market efficiency and integration, it also introduces challenges related to volatility, regulation, and technological dependency. As markets evolve—especially with the rise of 24/7 digital trading—time zone arbitrage will remain a critical area for institutional traders, high-frequency operations, and innovative investment strategies.
Ultimately, time zone arbitrage highlights the interconnectedness of global finance, demonstrating that even a world divided by hours can be united by the continuous pursuit of opportunity.
Global Green Energy Trading Trends1. What we mean by “green energy trading”
“Green energy trading” spans several related but distinct markets:
Physical electricity markets where renewable generation competes in wholesale power markets.
Corporate offtake markets / Power Purchase Agreements (PPAs) — long-term contracts linking buyers (often corporates) and renewable project sellers.
Renewable Energy Certificates (RECs) / Guarantees of Origin (GOs) — unbundled instruments that represent the environmental attribute of 1 MWh of renewable generation.
Carbon markets — both compliance (cap-and-trade) and voluntary carbon markets (VCM) for offsets/removals.
Trade in low-carbon fuels and commodities — early and fast-growing markets for green hydrogen, ammonia, and derivatives intended for shipping, industry, and storage.
Cross-border electricity and capacity trades, enabled by interconnectors and regional power pools.
Each sub-market has its own liquidity dynamics, price drivers, participants and integrity issues. Treating them as a connected ecosystem — where PPAs, REC supply, carbon pricing and hydrogen exports all interact — is essential to understanding modern green energy trading.
2. Market scale & capital flows: momentum, but uneven progress
Investment into clean energy technologies remains large and growing worldwide. Multiple 2025 trackers show record or near-record levels of investment in renewables and associated infrastructure, even while investment patterns differ by region. BloombergNEF and other trackers documented strong capital flows into solar, wind and storage in recent reporting, while public reports by the IEA and REN21 confirm renewables’ rising share of global generation.
Still, important caveats exist: while installed capacity is growing fast, investment is increasingly focused on solar PV plus associated storage; grid and transmission investment lags; and some regions face investor retrenchment owing to policy or market risk. That re-risking shows up in slower PPA volumes or higher financing spreads in specific jurisdictions — the headline number (global investment) masks significant regional divergence.
3. Electricity trading and PPAs: corporates and utilities reshape demand
Corporate demand for long-term PPAs has been a major growth engine for green trading. Large companies continue to sign deals to meet procurement and net-zero goals, supporting project finance. In 2024 corporates signed tens of gigawatts of PPAs globally, and while volumes fluctuate quarter-to-quarter, 2024–2025 figures still show hundreds of terawatt-hours of contracted renewable energy across major markets. The PPA market has also diversified — shorter tenors, virtual PPAs (financial-only), sleeved structures, and hybrid PPA + storage deals are now routine. LevelTen and market reports highlight these shifts in price discovery and contract structure.
Market implications:
PPAs reduce merchant risk for developers, unlocking capital for new projects.
Financial PPAs (VPPA) allow companies in non-renewable grids to buy green attributes without physical delivery.
The combination of PPAs and REC purchases makes an increasingly liquid “corporate demand stack” that supports project economics, particularly in markets with weak or absent compliance instruments.
4. REC, GO and attribute markets: unbundling clean electrons
REC markets (called GOs in Europe, I-RECs in some markets) are maturing and expanding. Demand drivers include corporate procurement, renewable portfolio standards, and voluntary claims verification. The size of REC markets has ballooned where corporate offtake meets supportive policy; where policy is weak, VPPAs coupled with RECs are common.
Key dynamics:
Price dispersion — REC prices vary enormously across geographies depending on policy support and renewable penetration.
Unbundling vs. bundled — growing debate over whether simply buying RECs (without matching delivery) is sufficient for claims of “using renewable energy.” Many corporates now aim for time-matched and location-matched procurement to reduce “additionality” questions.
Market innovation — “time-tagged” or “hourly” certificates and blockchain pilots for traceability are becoming more common.
This market still faces integrity questions: standardization of vintage, additionality, double-counting avoidance, and the interplay with compliance regimes require ongoing governance.
5. Carbon markets: compliance growth and voluntary market reform
Carbon pricing and trading remain central to the economics of green energy. The World Bank’s 2025 carbon pricing report shows that carbon pricing covers an increasing share of emissions and is mobilizing fiscal resources — but coverage and price levels are highly uneven.
Two parallel trends matter for green trading:
Expansion and strengthening of compliance markets. More jurisdictions are adopting or tightening ETS (emissions trading systems) and carbon taxes, increasing demand for high-quality credits and driving corporate hedging strategies.
Reform of voluntary carbon markets (VCM). After volatility and integrity scandals, the VCM is undergoing standardization — improved registries, stricter methodologies, and a market tilt toward removals and high-integrity nature-based or engineered solutions. Ecosystem Marketplace’s 2025 SOVCM documents this transition.
Impacts:
Carbon prices (and the existence of credible compliance markets) materially affect the levelized cost calculus for low-carbon fuels (e.g., hydrogen) and for investments in add-on abatement technologies.
The VCM’s reform will shape corporate net-zero strategies — companies increasingly seek verifiable removals rather than cheap, low-integrity offsets.
6. Green hydrogen & traded molecules: the next frontier
Green hydrogen (electrolytic H₂ powered by renewables) and its derivatives (ammonia, e-methanol) are moving from pilots to nascent global trade. IRENA and other analysts highlight strong potential for cross-border hydrogen trade, with resource-rich, low-cost renewable regions set to become exporters and industrial consumers (EU, Japan, Korea) as importers. IRENA’s 2025 analysis maps techno-economic potential for hydrogen and derived commodities, showing realistic export/import corridors emerging by 2030–2050.
Why hydrogen trade matters for trading dynamics:
Hydrogen opens a new commodities market with different logistics (electrolyzers, compression, shipping of ammonia or LOHCs) and new price formation mechanisms tied to electricity costs, electrolyzer capex, and shipping.
Early trade will be bilateral and project-based (offtake contracts, tolling arrangements), transitioning to more liquid spot/forward markets as infrastructure and certification (low-carbon hydrogen certificates) develop.
Countries with cheap renewables + coastal infrastructure (Australia, parts of the Middle East, North Africa, Chile) are positioning to be exporters; heavy industrial demand centers (EU, Japan, Korea) are positioning to be importers.
Risks: cost trajectories for electrolyzers, the timeline of dedicated shipping/port infrastructure, and the need for an international certification framework to avoid greenwashing.
7. Cross-border electricity trading and grid issues
As renewable shares rise, regional interconnections become more valuable: geographic smoothing of supply, optimized dispatch across time zones, and better utilization of variable renewables. Projects to expand interconnectors (Europe, Africa-Europe links, emerging interregional links in Asia) are gaining priority, but progress is constrained by permitting, financing and political coordination.
Market design consequences:
Larger, interconnected markets can reduce curtailment and lower system costs, but they also require harmonized market rules, congestion management and mechanisms to allocate transmission costs.
High penetration of renewables increases the importance of ancillary service markets (frequency, inertia, fast reserves) and the monetization of storage services through trading platforms.
8. Technology & digitalization shaping trade
Trading infrastructure, data and software are changing how green energy trades are executed:
Hourly / granular attribute certificates. Time-matched RECs and hourly settlement help link generation and consumption more credibly.
Trading platforms and marketplaces. Platforms for PPAs, RECs, and carbon credits (including tokenized assets and marketplace aggregators) improve liquidity and price discovery.
Advanced forecasting and AI. Better wind/solar forecasts reduce short-term imbalance costs and improve the value of battery-coupled projects; AI also optimizes scheduling and trading strategies for aggregated distributed energy resources (DERs).
Blockchain / registries. Pilots for immutable registries aim to reduce double counting and improve provenance — particularly important in voluntary markets and hydrogen certification.
These innovations lower transaction costs and allow new market entrants (aggregators, VPP operators) to participate, broadening liquidity.
9. Policy, geopolitics and industrial policy: winners and losers
Green trading does not happen in a vacuum: geopolitics and industrial policy decisions shape the supply chains and competitive advantages.
Industrial policy matters. Countries that invest in electrolyzer manufacturing, battery supply chains, and port/infrastructure for hydrogen can capture export value chains. IRENA and other analysts point to likely exporters and importers through 2050.
Trade frictions and ‘green industrial policy’. Governments are using tax credits, domestic content rules, and subsidies (e.g., IRA in the U.S., similar programs in the EU and Asia) to lock in upstream manufacturing — this can distort trade flows and prompt retaliatory measures.
Energy security arguments. The energy transition coexists with strategic concerns — countries are wary of dependence on single suppliers for critical inputs (batteries, rare earths, hydrogen), and that shapes trade and contracting patterns.
Geopolitical disruptions (e.g., shifts in trade alliances, sanctions) can quickly change routing and price dynamics for green commodities.
10. Corporate behaviour & financial innovation
Corporates are major demand drivers through PPAs, on-site generation, and REC purchases; financial markets are responding with new instruments:
Green bonds and sustainability-linked financing have become standard to fund projects.
Hedging structures: corporate hedges, merchant storage arbitrage, and hybrid contracts (capacity + energy + attribute) are being packaged to manage revenue volatility.
Insurance & de-risking products are maturing to address construction and merchant risk for green projects — critical to mobilize institutional capital.
Investor due diligence has also matured: financial crates now scrutinize grid access, congestion risk, and REC/offset integrity before underwriting deals.