Reversal Day in $NVDAAnother reversal day in Nvidia, but as you can see the stock has a tendency to recover quite quickly.
NVD trade ideas

$NVDA Started Accumulating on May 6NASDAQ:NVDA Started Accumulating on May 6, with our buy alert from our proprietary algorithm momentum indicator. ### Algorithm Momentum Indicator
The Algorithm Momentum Indicator (AMI) is a sophisticated trading tool designed to identify the strength and direction of market trends. By leveraging advanced computational algorithms, the AMI analyzes price movements, trading volume, and historical data to provide traders with precise signals for potential buy or sell opportunities.
#### Key Features:
1. **Trend Detection**:
- AMI uses mathematical models to detect the initiation and continuation of market trends.
- It helps traders identify whether an asset is in an upward (bullish) or downward (bearish) trend.
2. **Signal Generation**:
- The indicator generates clear signals based on momentum shifts, alerting traders when to enter or exit a position.
- Signals are typically represented by graphical elements such as arrows or color changes on the trading chart.
3. **Customizable Parameters**:
- Traders can adjust the sensitivity of the indicator by modifying its parameters to suit different trading strategies and timeframes.
- Customizable settings allow for fine-tuning to match individual risk tolerance and market conditions.
4. **Integration with Trading Platforms**:
- AMI can be integrated with popular trading platforms like MetaTrader, TradingView, and NinjaTrader.
- This ensures seamless usage and real-time analysis during trading sessions.
5. **Backtesting Capabilities**:
- Traders can use historical data to backtest the AMI, evaluating its performance over various market conditions.
- This feature helps in optimizing the indicator for better accuracy and reliability.
6. **Visual Representation**:
- The AMI often includes visual aids such as histograms, lines, or oscillators to represent momentum.
- These visual tools make it easier for traders to quickly interpret the indicator’s output.
Benefits:
- **Enhanced Decision Making**: Provides actionable insights that help traders make informed decisions.
- **Risk Management**: By identifying potential trend reversals, the AMI aids in managing and mitigating risks.
- **Versatility**: Suitable for various markets including stocks, forex, commodities, and cryptocurrencies.
- **Time Efficiency**: Saves traders time by automating complex calculations and providing ready-to-use signals.
Use Cases:
- **Intraday Trading**: Ideal for short-term traders looking to capitalize on quick market movements.
- **Swing Trading**: Helps swing traders identify medium-term trends to maximize gains.
- **Long-term Investing**: Assists long-term investors in confirming trend directions for strategic positioning.
The Algorithm Momentum Indicator is a powerful tool that combines advanced algorithmic techniques with practical trading insights, making it an essential component of any trader's toolkit.

where will $NVDA close this Friday 06/07?Bank of America recently raised its price target for **Nvidia (NVDA)** stock to **$1,500** per share. This implies about **37%** upside from Friday's closing price of **$1,095.45**. The increase in the price target follows Nvidia's announcement of its next-gen AI chip called "Rubin," which focuses on artificial intelligence applications. The company's accelerated pace of AI chip advancement likely contributed to this optimistic outlook.
Notably, other analysts have also raised their price targets for NVDA stock, with Goldman Sachs and KeyCorp offering positive projections.
Keep in mind that stock prices can be volatile, so it's essential to stay informed about any further developments. 🚀

NVDA: Buy ideaBuy idea on NVDA as you see on the chart because we have the breakout with force the resistance line by a big green candle follow by a large green volume.!

NVDA island reversal or is there further upside from here?On the macro side of things it seems like the dreaded stagflation scenario is more likely than not. With GDP slowing, inflation persisting and unemployment creeping up the overall economic outlook doesn't seem great. Add in the overseas tensions with two active wars and China seeming to increase aggressive talks on Taiwan, it would make any normal person hesitant to enter new positions.
With all that being said I find it hard to believe any of that has an impact on NASDAQ:NVDA performance over the next 2-3 years. With their significant lead in both hardware and their dominance in software with CUDA I don't think any true market share will be taken from AMD or Intel. NVDA has done a great job of creating a community around its products and companies are afraid to stray away from their products because they don't want their investors to worry about them falling behind competition.
Looking at the chart its had some significant bullish moves in the last month and many are worried of a potential island reversal. This is very possible with everyone worrying more and more about the economy, but I believe the corporate spend will continue to rise as many of the large cap companies have hoards of cash reserves to spend on R&D. Yes the lower end consumer is likely to be impacted over the next year, but the large caps are going to use their money now to advance their positioning in their subsequent markets. Yes the companies authorizing all this increase in spend for NVDA products will likely take a hit, but NVDA itself is likely going to continue dominating.
I see a slight draw down coming after the stock split possibly retesting previous trend resistance around 1050, but inevitably continuing this monstrous bull rally.
NASDAQ:NVDA NASDAQ:AMD NYSE:TSM NASDAQ:ASML

@nvda = 768 and consolidating before uptrend restarts NVDA , may consolidate and continue sideways before making another breakout to the upside..

Elon Musk Contributes to NVDA Price Surge to a New RecordElon Musk Contributes to NVDA Price Surge to a New Record
Yesterday, on Tuesday, Nvidia's stock price reached a historic high, surpassing the $1,130 mark, increasing by almost 7% relative to Monday's closing price. This happened after a turbulent past week, during which Nvidia published a very strong report that led to an over 8% rise in its stock price in one day.
Thus, since the beginning of May, NVDA's price has increased by approximately 34%. The latest surge in bullish sentiment was driven by the news that Elon Musk's company xAI is purchasing Nvidia AI chips for a new powerful supercomputer.
Investor’s Business Daily reports that in a presentation for investors, Musk stated that:
→ xAI will require up to 100,000 specialised semiconductors for training and launching the next version of its AI chatbot, Grok.
→ The supercomputer will use Nvidia H100 graphics processors.
→ Musk hopes to bring the supercomputer, which he referred to as a “gigafactory of computation,” online by autumn 2025.
Analysing NVDA's stock price last week, we:
→ Updated the upward channel;
→ Suggested that on a bullish impulse, NVDA’s price could approach the median line of the upward channel.
Technical analysis of the 4-hour NVDA stock chart today shows that:
→ The price is in the median line zone (which may act as resistance);
→ RSI is at its highest in a year.
Considering these factors, it is reasonable to assume that the market is excessively overbought and vulnerable to a pullback. A 1:10 stock split scheduled for 10 June could play a role. While Nvidia shares will become more accessible to a broader range of investors (a bullish sign), it is possible that the "buy the rumour, sell the news" principle may apply, and after a series of positive events for NVDA stock, its price may correct towards the lower boundary of the 2024 upward channel and possibly test the gap area (shown in purple).
Buy and sell stocks of the world's biggest publicly-listed companies with CFDs on FXOpen’s trading platform. Open your FXOpen account now or learn more about trading share CFDs with FXOpen.
This article represents the opinion of the Companies operating under the FXOpen brand only. It is not to be construed as an offer, solicitation, or recommendation with respect to products and services provided by the Companies operating under the FXOpen brand, nor is it to be considered financial advice.

NVDA May 29 Update #NVIDIA #NVDANVDA investors had a fantastic day yesterday, after the Green Gold skyrocketed and hits the 1040. during the night trading sessions the stock touched the 1060, and we are now seeing a major correction at the pre market session.
Investors can secure profits by setting a stop limit order at 1113 or 1084 depend on how aggressive you are.
Target price before the stock splits was estimated to be around 1200 which is very close ahead, and it can be reached by the end of today or by Friday max.

NVDA $720 after $600 like hot knife in cold butter NVDA is defying gravity and bearish expectations. possibly even $900 after earnings.
Shorts are piling in then burn, rinse and repeat.
The information and publications are not meant to be, and do not constitute, financial, investment, trading, or other types of advice or recommendations


$nvda update #Nvidia #NVDA update:
#Wallstreet back online after holidays with a familiar trend.
As major chipmaker stocks significantly outperformed the broader market.
Nvda stocks surged over 6% ->1.128, reaching New ATH.
( #ElonMusk xAI plans to build supercomputer fuel by #nvidea chips )
NVIDIA keeps on producing incredible results. We got ourselves another gap up to the next PPoint(1D). At this point we have adjust frames to continue analysis of the price movement but don't be surprised to see R5 touched, if R4 holds. Would like to see a double b bounce as with previous point for further confirmation.

looking for a short-term top in $NVDANVIDIA incorporates a platform strategy to grow in the Gaming, Professional Visualization, Datacenter, and Automotive markets. It is crucial to provide a complete computing solution and not just a chipset or software for its target markets. By focusing on the platform strategy, the company can seamlessly provide interconnected solutions that meet customer’s end-to-end needs.

$NVDA Jack in BoxSimple project where all lines from all rectangles are projected potential support and resistance. Looking to catch at least one reversal (in either direction) with a candlestick pattern or signal at any of them.
The vertical ones are more like time stamps for potential essential events like change in mood, sentiment, volatility or other.
The polygon is more like a zone where the probability of being penetrated is much lower than in other areas of the chart. This zone can provide a reversal too if it is accurate.
I will also be looking for potential consolidations inside the bigger rectangles which can lead to a breakout scenario from them, but I might be wrong on this envisioned scenario. Time will tell.
Will also try to cover with comments any relevant interesting Candlestick setups that catch my attention or interest.

I see the futureRemember this when you think something is unbeatable
Someone will cash his profits, a correction will happen at one point or another.

Nvidia Stock Surges Above $1,000 up by 5%Nvidia ( NASDAQ:NVDA ) has surged above the 1,000 level for the first time in a year, with its market cap racing past $2.5 trillion. The chip giant's earnings and sales growth have led it to pass or challenge Apple ( NASDAQ:AAPL ) and Microsoft ( NASDAQ:MSFT ) as the world's most valuable company. Nvidia ( NASDAQ:NVDA ) stock surged 15.1% last week to a record 1,064.19, blasting past 1,000. The chip giant increased its market cap by $338 billion to $2.661 trillion as of May 24, just behind Apple ($2.913 trillion) and not far from Microsoft ($3.196 trillion).
At the end of last year, Nvidia ( NASDAQ:NVDA ) had a $1.22 trillion market cap, lagging Google parent Alphabet ( NASDAQ:GOOGL ) and Amazon.com ( NASDAQ:AMZN ) in addition to Apple and Microsoft. Out of the Magnificent Seven stocks, Nvidia only had a higher valuation than Meta Platforms (META) and Tesla ( NASDAQ:TSLA ).
On May 22, Nvidia ( NASDAQ:NVDA ) reported Q1 2025 earnings per share of $6.12, up 461% vs. a year earlier, with revenue soaring 265% to $26.04 billion. Analysts expect Nvidia earnings to soar 107% in fiscal 2025 to $26.85 a share, followed by a 31% gain in fiscal 2026 to $35.12.
Microsoft, Apple, and the other Magnificent Seven stocks have various catalysts, but a lot of that reflects AI growth, or at least AI growth hopes that are good news for Nvidia. Megacap techs are spending massively on AI, with a lot of that going directly on Nvidia chips.
At the current $2.662 trillion valuation, Nvidia ( NASDAQ:NVDA ) just needs a 12.8% advance to reach $3 trillion, which would also pass up Apple's current valuation and greatly narrow the gap with Microsoft. Nvidia stock rose 4.5% early Tuesday, pushing the market cap above $2.75 trillion.
The Dow Jones Industrial Average fell Tuesday morning, as Wall Street digested economic data in the form of two housing reports. Artificial intelligence giant Nvidia rallied to more record highs, while GameStop ( NYSE:GME ) soared on the stock market today after raising nearly $1 billion from a stock sale.
Technically, NVIDIA Corp ( NASDAQ:NVDA ) stock is currently overbought with a Relative Strength Index (RSI) of 78.10.

Nvidia"Technical analysis suggests Nvidia may be forming a bull pennant pattern, potentially indicating future price movement within the range of $620-$1100."

(NASDAQ:NVIDIA) STOCK AT $100 POST SPLITTWO POTENTIAL BUYING OPPORTUNITIES UNDER $100
Key Information Breakdown
Stock Split Details
A 10-for-1 stock split means each share will be divided into 10 shares, reducing the price proportionally.
Post-split, the price of NVDA will be more accessible to a broader range of investors.
Current and Projected Prices
Current All-Time High: $1,120.08 per share.
Projected Price Post-Split: $106.425 per share (immediate post-split value).
Potential Price Dip: If the stock drops to fill the gap at $960.20, post-split price would be $96.02 per share.
Support Levels:
Before Split: $750.25
After Split: $75.025
Long-term Projection: Based on projected earnings and a forward earnings multiple of 39, the stock could reach $2,266 per share barring any splits or other significant events.
Potential Price After Five Years
The stock could jump to $58.11 per share after five years, considering typical market conditions and growth prospects.
Historical Performance
Five years ago, NVDA stock was priced at $33 per share.
The stock has since exploded by more than 3,000%, reaching $1,102.44 as of the latest open.
Analysis of Factors
Stock Split Impact
Perception and Accessibility: Lower share prices post-split could attract retail investors who find the new price point more accessible.
Liquidity: Increased number of shares could improve liquidity, making it easier to buy and sell shares without significantly affecting the price.
Market Conditions and Support Levels
Gap Filling: Technical analysis often considers gaps in stock prices as levels that need to be filled, suggesting possible dips to $96.02 post-split.
Support Levels: Strong support levels at $75.025 post-split could act as a safety net, potentially preventing further declines.
Long-term Growth Projections
Earnings Growth: Multiplying projected earnings by Nvidia's five-year average forward earnings multiple suggests substantial long-term growth, with potential stock prices reaching as high as $2,266 per share in five years.
Market Trends: Assuming the broader market trends remain favorable, and Nvidia continues its trajectory in technology advancements and market dominance.
Historical Performance Insight
Nvidia's historical performance shows a significant increase in stock value, with a more than 3,000% rise from $33 per share to over $1,100.00 in five years.
This explosive growth reflects Nvidia's ability to innovate and capture market share in high-growth areas like GPUs, AI, and data centers.
Opportunities to Buy
Under $100 post-split:
Two potential buying opportunities under $100:
If the current all-time high is the peak at 1,120.08 a drop to $960.20 ($96.02 post-split) might occur to fill the gap.
Next strong support level at $750.25 ($75.025 post-split) provides another entry point.
Conclusion
Nvidia's 10-for-1 stock split could significantly impact investor perception, making the stock more attractive and accessible. The historical performance suggests that Nvidia has a strong track record of growth, increasing more than 3,000% over the past five years. While the stock might experience some volatility, with potential dips to $96.02 and support at $75.025 post-split, long-term projections remain robust. Based on historical performance and future earnings estimates, Nvidia's stock could reach impressive highs, potentially hitting $2,266 per share over the next five years. Investors should consider these factors and monitor market conditions for optimal entry points.
🚀🚀Boost this idea to reach more people like you! 🚀🚀
NFA
PLEASE, DYOR/MYOD!!
Hope to See your Likes 👍 to Support My Work
To Follow All My Ideas, Go to My Profile and Select the Follow Green button 😁
Please Re-Evaluate Before Make Your Last Decisions
Check my Profile for more.

NVDA Bull Call Spread (302 DTE) directional playBull Call Spread on NVDA expires May 21st 2025
-1400 +1360
Premium $ 3,178.00 on $ 822.00 or 386% gain, will close early as NVDA continues to rise

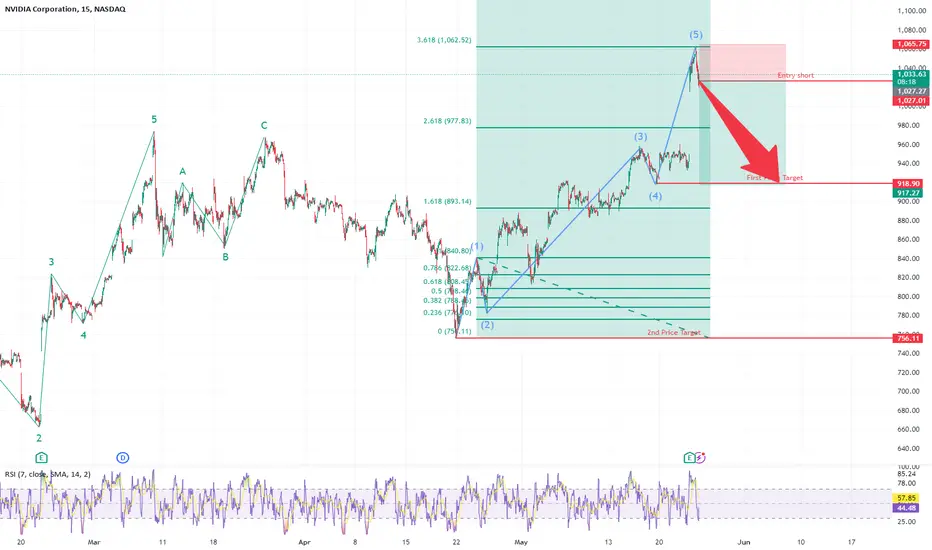
NVDA short: Hit Price Target from Fibonacci extensionI had previously mentioned to wait to short NVDA with resistance around $970 and expected their earnings to push the stock to gap up to just below $1000 (I had expected around $991). But good thing is that it gapped up way above the 2 prices mentioned above and actually made a perfect top at the Fibonacci extension level. Meaning if people had waited according to what I said, they could enter the short position at a much more favourable price.
🔥🚀 **NVDA Update 27 May Gap Up Mania or Brief Correction! ** On Thursday, NVDA skyrocketed, smashing through the roof with a new high of 1063.13! By Friday, it closed above the last swing high at 1064.89, signalling a strong continuation of the bullish trend.
Investors are eagerly gearing up for a thrilling Tuesday, anticipating powerful moves ahead. Two exciting scenarios could unfold:
1️⃣ **Gap Up Mania!** 🌟 - With market sentiment glowing with positivity, we might see another gap up, potentially pushing the price to a staggering 1134, mirroring the previous exhilarating gap.
2️⃣ **Bullish Correction!** 📉➡️📈 - Alternatively, a brief correction to 1032 could set the stage for an even stronger uptrend.
The RRG analysis is buzzing with optimism, showing the XLK and SMH sectors in the leading quadrant.
Conclusion:
Get ready!! because NVDA is poised for an electrifying ride! 🌟📈💥

NVDA looks strong NVDA looks to be ready for a bull ride up even one hour is above the 50ema and the daily had a good day on Thursday with bulls holding trades

Can we go back to reality?Congratulations NVDA, because you delivered everything you could deliver in terms of good results, however, can we get back to reality?
Will the Black Monday that we experienced in 1987, in the DOW JONES index, be experienced again in 2024, and thanks to NVDA and technology companies?
We know what happened between 1980 and 1985 to the American economy, right?
It is known that in the 1980s and early 1990s, dollars could circulate freely around the world, so much so that we had a global economic miracle, and the world was swimming in booming growth.
But, at the current moment, dollars can no longer circulate freely around the world (FED, China, Russia) and continue contributing to global growth? Therefore, the technological war we are experiencing today (chips and electric cars), diverted dollars to these sectors, further inflating this bubble that is about to burst.
Speaking of electric cars, China is firmly dumping its electric cars around the world at very reasonable prices (as it has no intention of breaking its internal market – control), once and for all destroying the automobile industry in many emerging countries, oh my, no?
Let's go graphics.
Monthly: NVDA has reached the three golden levels of the FIB of the SETUP used, so there is nowhere else to go. So, SPX, get ready.
The red lines are resistance points.
Weekly: With the brilliant financial report recently released, prices are ready to seek the golden region of this chart period.
The red lines are resistance points.
Daily. Prices have reached the region of 100% of the bullish pivot.
The red lines are resistance points.
Do your analysis and good business.
Be aware, if you buy, use stop loss.
See other graphical analyzes below.

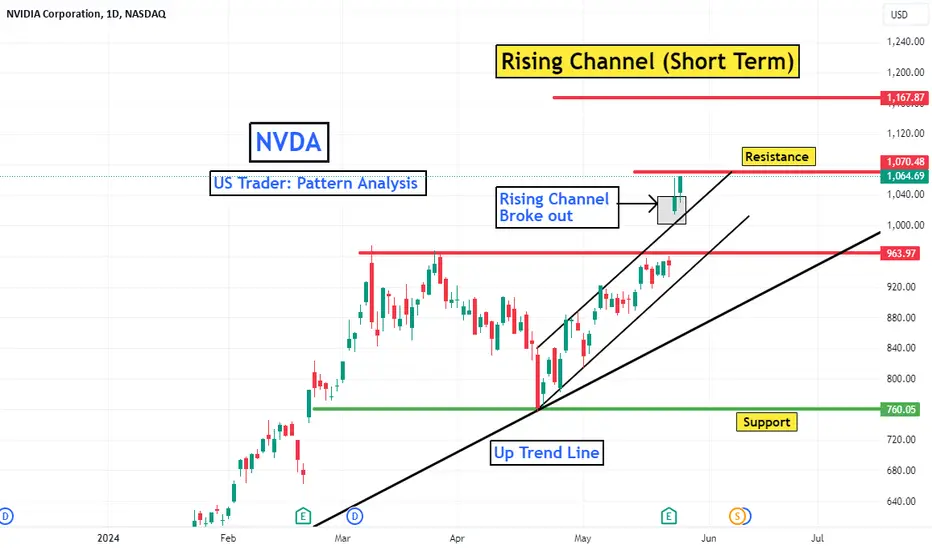
NVDA: Rising Channel (Short Term)Key Points: NASDAQ:NVDA
1. A raising channel shows a clearly defined uptrend. It is generally considered a bullish continuation pattern.
2. A breakout above an ascending channel can signal a continuation of the move higher.
3. A breakdown below an ascending channel can indicate a possible trend change.
Notice :
looking for a job
------------------------
Is Your company hiring an assistant day & swing Trader/ assistant technical analyst/ assistant equity analyst?
I am a day & swing trader, freelancer technical analyst & equity analyst. Now, I am looking for a job .
Skills: Chart analysis, Trend identification, Price pattern recognition, important support and resistance levels identification,
Set up trade idea ( long /short),
Set up entry and target price.
Valuation, making analysis report etc...
Experience: 5 years.