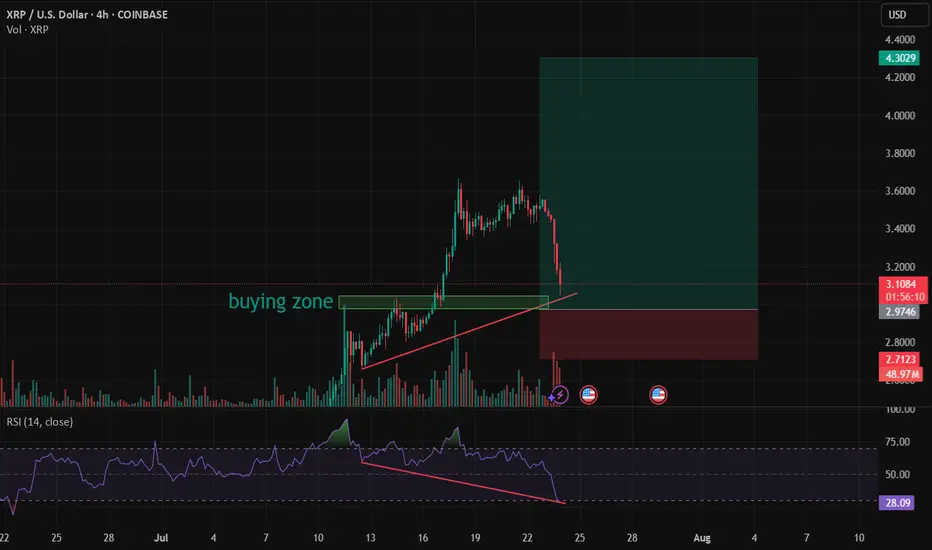
Retest before it goes again ?This set up is not usually on my playbook but seen the strong momentum the XRP is having, this hidden divergency is as good as it comes, with good potential to workout. I believe if it does the first target will be around 4.30.
XRPUSD.P trade ideas
XRP/USD – Bearish Shift After Momentum Exhaustion🧠 Summary:
XRP/USD has shown clear signs of exhaustion after sweeping the previous high. Following a breakout from a daily bull flag, price struggled to hold momentum near the key level of 3.4194, forming an ascending channel that eventually broke down. Liquidity zones below current price are now in focus.
🔍 Technical Breakdown:
✅ Daily Bull Flag → Broke out with strength
⚠️ Rejection near Previous High (3.4194) → No follow-through
🔼 Ascending Channel → Formed post-impulse, now broken
📉 Momentum Shift → Structure flipped bearish
💧 Liquidity Zones (LQZ) below price acting as magnets
📌 Key Levels:
🔹 Last High: 3.4194 (Rejection Point)
🔹 Broken LQZ: 3.2868
🔹 Current Support: 3.1689 (LQZ - being tested)
🔹 Target 1: 2.9849 (4HR Liquidity Zone)
🔹 Target 2: 2.7667 (Daily Liquidity Zone)
🧩 Confluences:
Liquidity sweep of prior high
Momentum loss near key resistance
Break of ascending structure
Retesting broken zones with room below
⚠️ Final Thoughts:
This trade is playing out just as we described in the post before this on XRP. We discussed watching how price would react to this area before making any type of "Late Entries". XRP is still a huge and vital part of the Crypto Eco System so long term i am holding my Long position. The areas on the chart are still great areas to buy in at "Dollar Cost Average". This will be one of those positions that though it may be bearish on the lower time frame you need to zoom out and always keep an eye on the weekly and daily chart before making any drastic moves.

XRP/USD H1 Educational Market Analysis – Support-Based XRP/USD H1 Educational Market Analysis – Support-Based Long Opportunity
🔍 Structure Overview:
• Support Zone: $3.21 – $3.23
This level has acted as a strong liquidity pool and base for past bullish moves. Price has tapped into it, showing signs of potential demand returning.
• Resistance Zone: $3.65 – $3.70
Acts as a key supply zone, where previous bullish attempts failed. Targeting this area after a rebound is technically sound if structure confirms.
⸻
🔄 Price Action Insights (H1):
• Price broke down through EMAs (20/50/100/200), confirming short-term bearish pressure.
• A rejection wick from support hints at possible absorption of selling pressure.
• If price forms a higher low structure above $3.25 and reclaims EMAs, a potential bullish reversal may unfold.
⸻
🧠 Educational Note:
• H1 charts are ideal for intraday strategies, and this structure provides a clear example of:
• Support-resistance dynamics
• The use of EMAs as trend confirmation tools
• Reversal vs. continuation setups
⸻
🎯 Intraday Bullish Scenario:
• If price holds above $3.21 and breaks above the $3.40 (EMA cluster), bulls may push toward the $3.55290 target.
• This level aligns with the mid-range of the resistance zone, offering scalp-to-swing potential.
⸻
🚫 Bearish Risk:
• Failure to hold $3.21 could lead to a deeper correction toward $3.10 or even $3.00.
• Confirmation of bearish continuation would be a lower high rejection from EMAs without reclaiming them.
⸻
📌 Summary:
On the H1 chart, XRP is at a critical support. Watch for a clean bounce and break above EMAs for a move toward $3.55. However, losing $3.21 could attract further downside. Use price action confirmation before entries.

XRPUSD Technical Analysis — Bearish Retracement in PlayXRPUSD Technical Analysis — Bearish Retracement in Play
Overview:
XRPUSD is currently exhibiting signs of bearish momentum after failing to break through a key resistance zone. Price action suggests a potential retracement towards the marked target level of 3.39519, supported by multiple technical indicators and price structure.
Key Technical Levels:
Immediate Resistance: 3.70 – 3.75 (strong supply zone; price rejected here multiple times).
Support Zone: 3.30 – 3.39 (prior demand zone and EMA confluence).
Target: 3.39519 (short-term bearish target as marked on chart).
Current Price: 3.50 (as of chart time).
Indicators & Price Action:
EMA Analysis:
EMA 20/50 (red/orange) are flattening out, indicating weakening short-term momentum.
EMA 100 (cyan) acts as current dynamic support.
EMA 200 (blue) is far below, suggesting room for deeper retracement if sentiment weakens.
Price Structure:
XRPUSD formed a double top near resistance, followed by lower highs.
Recent candle patterns show indecision and possible distribution.
Projected bearish leg toward 3.39519 suggests sellers are in short-term control.
Conclusion:
XRPUSD is likely to retest the 3.395 support level after rejecting the upper resistance zone. The bearish structure is supported by EMA alignment, price action, and repeated failure to break resistance. A break below 3.395 could open further downside towards 3.31. However, a strong bounce from support could invalidate this setup.
Trade Bias: Short-term bearish toward 3.395, watching for reaction at support.

Xrp's next low I've already taken all profit at the 3rd angle vioation at the top of this run. Now I will buy back in 20%-25% lower, when Xrp hits this next beasrish target between $2.75 - $3.0.
See you at the top of this next rally up.

XRP to $6?The optimistic target of $6 in 30 days is overpromised, unless a major developement comes from the White House.
Read more at: www.cointrust.com

You Are Getting Ripped Off On XRP Contd.... Once again for all the hype on xrp it still can not break the all time high.
Like I said 2 weeks ago when the price was at 3.60, I will see you at $3.00 by August 1st..
Its fading and the death nail will come 5-8 days from now.
The whole crypto market will crash. The slide starts in August.
I will be buying XRP for 55 cents in 2027.
Also Silver will outgain XRP in the next 2 years by 400 percent.
Laugh and mock all you want.
Come see me August 1st.

The trend is your friend!Still respecting the trend. Maybe this week a push to the upside of 3.80 maybe 4.00

XRP bearish divergence XRP 4hr showing bearish divergence on RSI as price breaks down from trendline support.

XRPUSD - BEARISH DIVERGENCE DESPITE STRONG BULLISH PRESSUREXRPUSD SIGNALS BEARISH DIVERGENCE DESPITE STRONG BULLISH PRESSURE. WHAT TO EXPECT?👀
Ripple has been moving bullish since July 9, the same as the ETHUSD, reaching the 3.60600 resistance level. Strong bearish divergence on RSI is observed.
What is the bearish divergence?
Bearish divergence is a technical analysis pattern where the price makes higher highs in an uptrend, but a momentum indicator (e.g., RSI, MACD) forms lower highs, signaling weakening bullish momentum and a potential downward reversal. To trade, identify the divergence in a clear uptrend with the indicator showing lower highs (e.g., RSI above 70). Sell or short when the price confirms a reversal (e.g., breaks below a support level or trendline) with increased volume. Set a stop-loss above the recent high. Target the next support level.
Here the closest support level is local support 3.00000. is the price drops below the EMA20 on 4-h chart, there are high chances of reaching this level.

XRPUSD – Trend Bent, Bias BearXRP broke structure on the downside after failing to hold $3.59, slicing through the 200 SMA. Momentum flipped bearish with RSI stuck under 50, signaling distribution phase. Support rests at $3.42. Bulls need a fast reclaim of $3.50 to regain control — until then, lower highs dominate.

$XRPBullish Bias: The chart suggests a bullish outlook with a breakout from a multi-year wedge and Fibonacci targets as high as ~$16.8.
Current Pullback: The price is pulling back after breakout (possibly retesting previous resistance as support).
Risk Area: Orange box shows a potential invalidation or pullback zone before another rally.
Descending Broadening Wedge (Pattern)
A large wedge spans from 2017–2025, marked by two converging black trendlines.
XRP has broken above the wedge (bullish breakout).
Fibonacci Levels (Orange horizontal lines on the right)
0.618: ~$5.91
0.786: ~$17.87
0.88: ~$32.06
These levels are likely drawn from the ATH (All-Time High) to a major low.

XRP 1H Cup and HandleCOINBASE:XRPUSD COINBASE:XRPUSD
On the 1H time frame XRP has broken all time highs to $3.66, then dropped $0.30, forming a perfect cup and handle. XRP is now gaining momentum to break the neckline, heading into to an explosive equal move up to $4.

xrpusd monthlyjust woaw,
who will not like when the chart speaks itself and here it speaks itself
target is very logical, reasonable
we ll see in the future we would be there or not

XRP - Ready for Next LegXRP recently made a new all time high at $3.66. But what we are seeing could give credit to even higher highs about to be developed.
What we have seen over the last few days of price action is market structure respecting our old 2025 ATH.
Any dips we have seen have developed lows between $3.30-$3.40. Creating this in to what seems to be a new level of support.
In this post we outlined how that yellow dotted line (key level) would play a role in future price action. So far that is what has happen and we are seeing beautiful market structure develop.
If XRP is to break the $3.66 level we are likely to see a rapid increase in price. Some of the levels that could end up becoming key levels for the future are these:
$3.90
$4.20
$4.50
$5.30

XRP to $10? 🚨 XRP to $10? Here's What No One Is Telling You 💣
XRP is quietly being tested as a global liquidity bridge by BRICS & Gulf nations. If Ripple powers the rails of future CBDCs…
$6.50 to $10 XRP becomes a math problem — not a fantasy.
✅ Ripple IPO incoming
✅ U.S. relisting possible
✅ Token supply shrinking
✅ Wall Street quietly watching
This isn’t hype. It’s the sleeper setup of the decade.
Would you hold XRP if it replaced SWIFT?

Based on real-world utility and institutional integrationXRP is evolving from a speculative asset into a strategic tool for global finance. If Ripple continues to convert partnerships into active XRP usage and ETFs gain traction, XRP could be a strong long-term play. But like all crypto investments, it demands careful risk management and a watchful eye on regulatory shifts
Hex on PulseChain mirrors XRP over time, $0.003 -> $3.40 (5yrs)Attention Poverty Investors 💀
While you were crying about your Hex bags at $0.003, XRP holders were getting absolutely REKT for 4-5 years straight. "Dead project!" they laughed. Then those same clowns FOMO'd in at $3 when XRP went nuclear in 2017.
1,133x gains for the psychopaths who didn't paperhand like little babies.
Now HEX sits at the EXACT same $0.003 graveyard for 5 years. Same high supply. Same "ngmi" energy. Same braindead price action that makes moonboys rage quit.
But here's the thing, anon: Alt-season is coming and history doesn't give a %$@! about your feelings. When high supply coins pump, they pump VIOLENTLY. Ask the XRP OGs who went from eating ramen to driving Lambos.
Translation for smoothbrains:
HEX at $0.003 for 5 years = XRP at $0.003 for 5 years.
If you can't see the pattern, stay poor.
$3.40 HEX incoming? Maybe. Maybe not. But if you're not at least considering it, you're ngmi.
This is not financial advice, it's a reality check for all you $0.003 stablecoin holders 🤡
WAGMI or cope forever. Your choice.

XRP 1H Chart Analysis - Breakout PotentialThe price is currently testing the 0.702 resistance level on the 1H chart, a key zone with historical rejections. A decisive break above 0.702, confirmed by a strong bullish candle and higher volume, could target 1.363. If the price breaks above 1.000 with solid confirmation, XRP might enter price discovery, pushing toward uncharted highs.
Key Levels:
Resistance: 0.702 (current), 1.000 (major), 1.363 (next target)
Support: 0.469, 0.382, 0.236
Strategy:
Enter long on a confirmed break above 0.702, aiming for 1.363, with a stop-loss below 0.469 (1:2 risk-reward).
For a 1.000 breakout, go long with a stop-loss below 0.702, using a trailing stop as prices extend.
Watch for volume spikes to validate moves.
Alerts:
Set an alert at 0.702 for a 1% break above.
Add an alert at 1.000 for a 1% break above to catch price discovery.
Stay cautious of false breakouts and monitor real-time data for confirmation.

XRP consolidation close to done, 10$ next- update on this analysis, made more than half a year ago:
- since then Ripple has been consolidating at a high level
- history doesn´t repeat but it does rhyme is the famous saying - in case of XRP it looks like price action is literally repeating the 2017 playbook with an initial impulse - consolidation - followed by another impulse
- target of the macro triangle pattern is north of 10$ per XRP, likely to get reached by the end of the year

Ripple analysis, long-termAccording to the latest analysis, Ripple's price rose from $0.50 to $2. Further, the price is analyzed to be likely to decrease to the $1 range with a dark $4 and $3.50, which in the long term can be expected to increase Ripple to this price range.
Sasha charkhchian

XRP Weekly ChartPrice made new ATHs on Friday went as high as $3.66, taking out the previous high at $3.39.
See if this week closes above, the monthly candle would give a stronger confirmation.
Anything could take price to $5+ or back down to $1.

XRP : KEEP simpleHello there.
Simple chart. XRP will never 3.50 probably again if we look chart. Is this a false breakout ? Just wait the confirmation in Weekly first, and monthly second.
This can be brutal. Like LTC and XLM, CRYPTO dino.. will run the world. I'm not a augur, but we look only the chart.
Good luck... Spot here is very good, you miss all ? Don't worry, you can gain a lot here, and if not, don't worry the life always end.
Good luck
