Why Greed Controls Most Traders During Market PumpsHave you ever felt greed controlling your decisions?
Every trader, even professionals, has fallen victim to this emotion at least once.
This analysis provides strategies to understand greed and avoid emotional trading mistakes.
Hello✌️
Spend 2 minutes ⏰ reading this educational material.
🎯 Anal
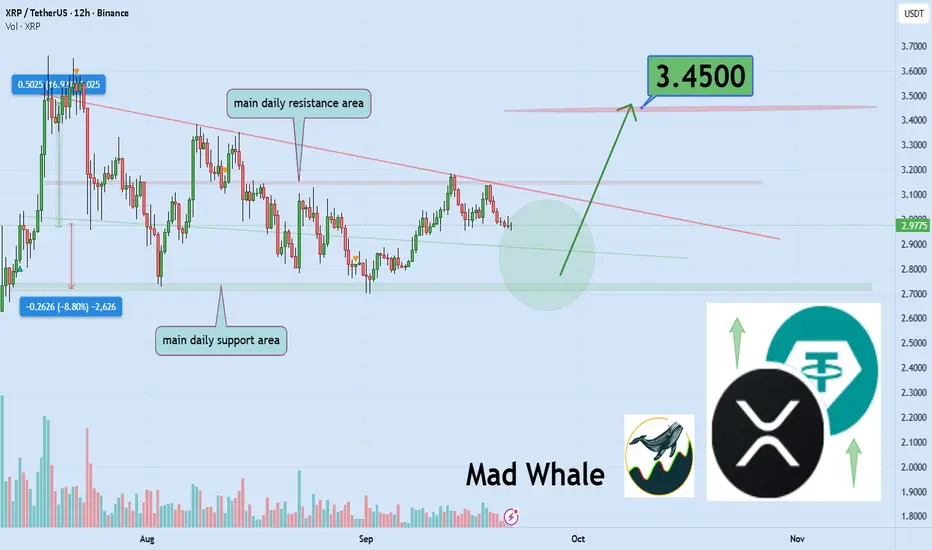
XRP - Triangle Breakout, Eyes on 3.2?XRP broke out of its descending triangle on the daily and shifted the structure bullish. Price is now trading inside the 3.00–3.20 resistance band.
This zone is key 🔑. It’s prior supply and the top of the range. A clean daily close above 3.20 would open 3.40, then 3.60+ inside a fresh markup leg.

DeGRAM | XRPUSD held the $2.8 level📊 Technical Analysis
● XRP rebounded strongly from the 2.76 support line, rejecting the breakdown and signaling a bullish reversal.
● Structure shows a recovery setup within the ascending channel, with upside potential toward the 3.67 resistance zone.
💡 Fundamental Analysis
● Ripple benefits fr

XRP Analysis – Watching Key Levels Ahead of FOMCXRP Analysis – Watching Key Levels Ahead of FOMC
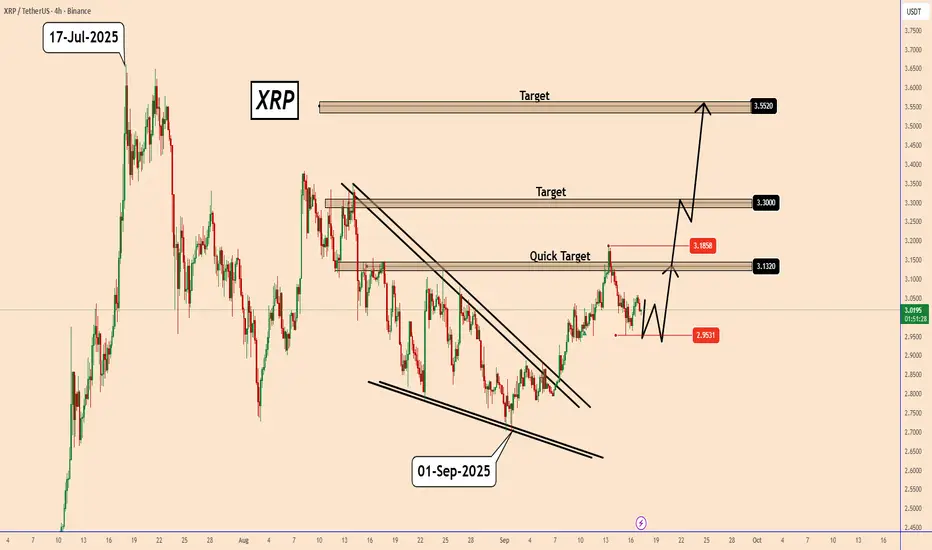
As per our previous analysis, XRP broke through the first target and reached 3.18. The bullish move was followed by a sharp correction down to around 2.95.
Today, XRP confirmed another bullish pattern. If it holds ahead of the FOMC meeting, the pri
XRP Swing Long Opportunity - LRKZ MODELXRP Swing Long Opportunity
📊 Market Sentiment
FED has resumed its rate-cutting cycle, starting with a 0.25% cut in September, with two more 0.25% cuts expected in the coming months. Additionally, institutional liquidity inflows have accelerated as the U.S. officially adopts crypto as part of its

XRP/USDT SHORT TERM ANAYSIS % PROFIT XRP, have been on a downtrend on a few days ride, but recent improvement in price movement noted, right now it's facing a resistance level, which in the past couple of days was a support level for the price before it took a ride to bears market, , if right now the market is to fill the imbalance we

XRP is approaching to supply zone Market Structure is still in downtrend with the price approaching to our supply area, we can see a overbought level in the rsi indicating a potential reversal.
Additionally, GDP Growth Rate QoQ Final will start later at 8pm New York time so high volatility is expected but I'm seeing a bearish here

$XRP Mild Bearish (September 25, 2025)BINANCE:XRPUSDT
CRYPTOCAP:XRP Mild Bearish Bias with Neutral RSI Hinting at Rebound Potential
Current Chart Analysis:
Overall Price Trend: XRP has declined from highs around 3.0 USDT earlier in the period, now at about 2.82-2.85 USDT (per chart labels). Recent candlesticks show a mix of red (

XRP Market Update📊 CRYPTOCAP:XRP Market Update
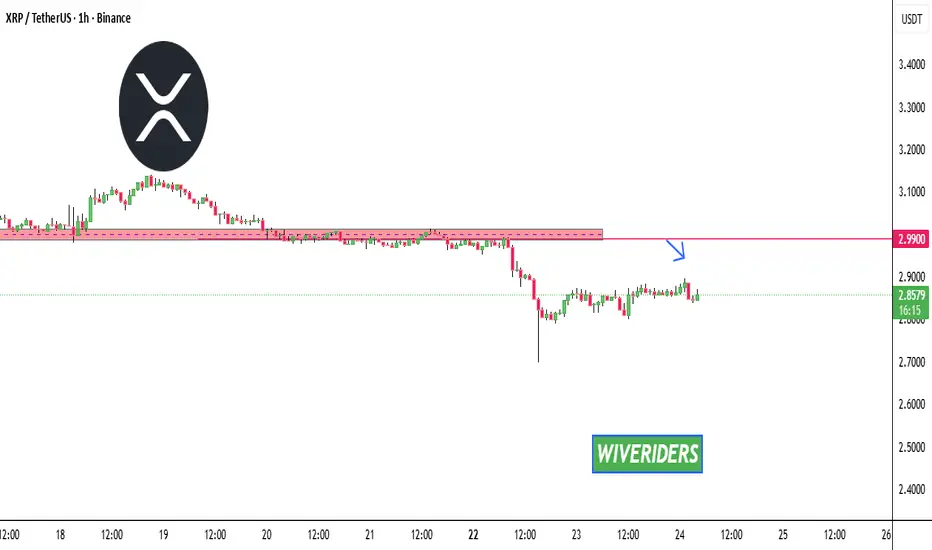
If CRYPTOCAP:XRP reaches the red resistance zone 🔴, wait for confirmation before entering a short position ⚠️
This is the level where sellers are still active and could push the price down again 📉
XRPUSDT XRP is in a corrective phase inside a downtrend channel after a sharp rally in July.
If XRP holds above 2.70 USDT and bounces, it may retest 3.0–3.2 USDT (channel midline).
If it breaks below 2.70 USDT, the next major support is near 1.95 USDT (strong demand zone).
RSI doesn’t show extreme condit

See all ideas
Summarizing what the indicators are suggesting.
Oscillators
Neutral
SellBuy
Strong sellStrong buy
Strong sellSellNeutralBuyStrong buy
Oscillators
Neutral
SellBuy
Strong sellStrong buy
Strong sellSellNeutralBuyStrong buy
Summary
Neutral
SellBuy
Strong sellStrong buy
Strong sellSellNeutralBuyStrong buy
Summary
Neutral
SellBuy
Strong sellStrong buy
Strong sellSellNeutralBuyStrong buy
Summary
Neutral
SellBuy
Strong sellStrong buy
Strong sellSellNeutralBuyStrong buy
Moving Averages
Neutral
SellBuy
Strong sellStrong buy
Strong sellSellNeutralBuyStrong buy
Moving Averages
Neutral
SellBuy
Strong sellStrong buy
Strong sellSellNeutralBuyStrong buy
Displays a symbol's price movements over previous years to identify recurring trends.