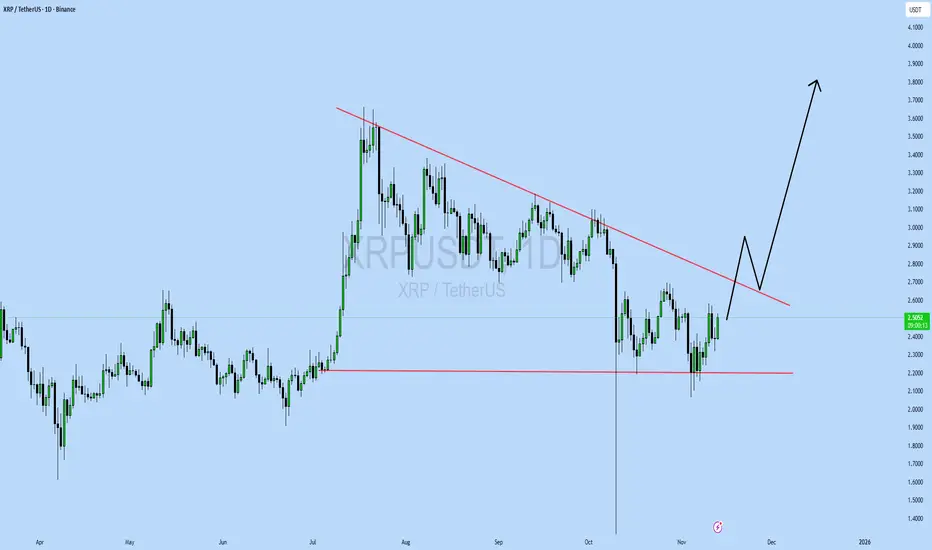
XRP all time highXRP is starting to reverse. Next week could be the week when it starts climbing to reach and break all time highs before or beginning of NEW YEARS.
Trade ideas

XRPUSDT.P - November 22, 2025The chart for XRPUSDT shows a sustained downtrend, confirmed by a descending trendline and a consistent pattern of lower highs and lower lows. Price action is currently consolidating below the trendline, with resistance around 1.95 and key support marked near 1.72 and 1.32. Momentum remains bearish; a failed recovery above resistance could trigger a sharp move down to the next support zone. If buyers regain control and break above the trendline, a short-term reversal toward 1.95 is possible, but overall trend structure favors sellers.

XRP Reverses on Sacred Time – Watch Friday 03:00 UTCXRP/USDT 1H – Sacred Geometry Update (Nov 20, 2025)
Current price: ~$2.007 (just wicked into the exact pre-calculated time window and reversed within minutes)
What you’re seeing:
- Anchor placed on the local high from Nov 17
- Forward-projected vertical lines come from one fixed geometric ratio measured directly from the Great Pyramid (no repainting, no optimization)
- Every major swing since Nov 17 has respected these lines to the minute — tonight’s drop from $2.15 tagged the confluence zone perfectly and bounced hard
Next high-probability pivot window (marked on my private grid):
Friday, November 21 – 03:00 UTC (±2 hours)
This is the next 1080-level hourly + daily overlap. In the current oversold environment (RSI 28, heavy selling pressure), these clusters have historically produced sharp reversals or brief accelerations followed by stronger turns.
My personal plan for transparency:
- Watching for a confirmed 1H close above $2.05 after 01:00 UTC tomorrow
- Targets: $2.12 → $2.18 → $2.25
- Stop below today’s low (~$1.98)
The actual lines are generated by a private invite-only tool (PyraTime™) that simply decodes ancient geometry into modern time. Same constant works on BTC, Gold, ES, Forex — no changes needed.
Happy to explain the math or show more live examples in the comments.
Not financial advice — just sharing a pattern that keeps repeating with eerie precision.
#XRP #Ripple #Gann #SacredGeometry #TradingView

#XRPUSDT: Bullish Reversal Coming With Price Heading Back To 3.5## XRPUSDT Analysis: Long-Term Perspective
In the long term, we anticipate the XRPUSDT price to revert to its all-time high of 3.5. From a fundamental analysis standpoint, we maintain a positive outlook, with the potential for the price to surpass 3.5. We have identified a favourable trading opportunity, as illustrated in the chart.
Our approach is neutral, as the trend remains undecided. Based on the duration of your positions, you can set two targets:
1. **Short-Term Target:** If you intend to hold your positions for a short period, aim for a price level above 3.5.
2. **Long-Term Target:** For long-term investors, a target price of 4.0 or higher is plausible.
We are committed to providing comprehensive analysis and support. Should you have any inquiries or require further clarification, please do not hesitate to contact us.
Additionally, we would appreciate your insights on which cryptocurrency pair you would like to explore next.
Regards,
Team Setupsfx_

DeGRAM | XRPUSD will test the $2 level📊 Technical Analysis
● XRP/USD remains inside a broad descending channel, rejecting the upper resistance line near 2.45 and failing to reclaim the broken structure.
● Price is retesting the 2.25–2.30 resistance zone from below, and rejection here opens the path toward the 2.00 level and the channel’s lower boundary.
💡 Fundamental Analysis
● Ripple faces renewed pressure as broader altcoin sentiment weakens and regulatory uncertainty persists.
✨ Summary
Resistance: 2.25–2.30. Targets: 2.05 → 2.00. Medium-term bearish bias below channel resistance.
-------------------
Share your opinion in the comments and support the idea with a like. Thanks for your support!

How Can XRP ETFs Prevent Price Crash To $2 This Month?XRP trades at $2.14 and currently rests on key support at the same level. The asset has been locked in a downtrend for nearly a month, struggling to break out despite periodic attempts. Without external catalysts, XRP risks drifting lower as bearish momentum persists.
However, XRP may avoid a deeper decline as the likelihood of ETF approval increases. Bloomberg ETF analyst Eric Balchunas noted that the SEC released guidance allowing issuers to speed up filing effectiveness, likely to clear regulatory backlog. Bitwise’s XRP ETF is reportedly next in line, and any progress could improve market sentiment instantly.
If bullish momentum continues and ETF expectations strengthen, XRP could climb to $2.28 and then $2.36, breaking free from its downtrend. If momentum weakens or ETF decisions face delays, XRP may resume its slide and potentially drop 6.8% to reach $2.00. This would invalidating the bullish thesis.

What's Happening or The Shadow of a Quantum Apocalypse💥 Birth of a Threat
Quantum Dawn and Shor's Algorithm
Quantum computers using the principles of superposition and entanglement are no longer science fiction. Major players like IBM and Google are actively working on creating machines capable of solving problems beyond the capabilities of classical supercomputers.
The main threat to the digital world, including the entire cryptocurrency industry, lies in Shor's algorithm.
Shor's Algorithm (1994)
Mathematician Peter Shor proved that a quantum computer can efficiently (in polynomial time) factorize large numbers and solve the discrete logarithm problem.
Vulnerability: The RSA and ECDSA cryptographic systems that underpin the public/private key security of most blockchains (including Bitcoin and Ethereum) will become useless. A public key revealed during the first transaction would allow a quantum computer to compute the private key almost instantly.
When Will "Q-Day" Happen?
Timelines for the emergence of a quantum computer capable of breaking widely used cryptographic schemes vary, but the trend points to an acceleration. This point has been dubbed "Q-Day" (the quantum equivalent of Y2K).
Probability Estimates:
A Global Risk Institute survey (2025) estimates a 22.7% chance of breaking RSA-2048 by 2030 and a 50% chance by 2035.
Expert Opinions:
Vitalik Buterin (November 2025) estimated the chance of Ethereum being hacked at 20% by 2028. The Cloud Security Alliance associates "Y2Q" with the date April 14, 2030. IBM plans to release the Nighthawk chip with over 2,000 logical qubits by 2029.
"Harvest Now, Decrypt Later" Strategy:
Recognizing the inevitability, intelligence agencies and attackers are already collecting encrypted traffic (including transactions) for subsequent hacking when quantum machines become available.
Cryptocurrency: The Perfect Victim and the Price of Inaction
Cryptocurrencies are an ideal target because many addresses contain funds associated with already compromised public keys.
Vulnerable Assets:
An estimated 25-30% of all Bitcoin (4-6.65 million coins), including Satoshi Nakamoto's funds, are held in vulnerable P2PK addresses.
Consequences:
Collapse of trust and asset losses exceeding $2.4 trillion (estimated for 2025) if timely migration is not implemented.
🛡️ Survivors: Cryptocurrencies that have adopted PQC
Blockchain's survival in the era of quantum computers depends on one key condition: abandoning vulnerable cryptographic primitives (RSA and ECDSA) and transitioning to post-quantum cryptography (PQC). PQC solutions (based on lattices, hash functions, or Winternitz OTS) are resistant to Shor's algorithm. The market for quantum-resistant (QR) cryptocurrencies is growing, offering ready-made solutions for hedging risks.
Leaders of the QR Resistance and Their Technologies:
Not all blockchains will give in. Since the 2010s, pioneers have been building "quantum-resistant" coins using lattice-based, hash-based, or Winternitz OTS schemes—they ignore Shor like a rock ignores waves. The QR crypto market is growing at 28.6% annually until 2034. Top 9 as of November 2025:
Zcash (ZEC): shielded pool on BLS12-381 + Groth16—fully quantum-resistant as early as 2022; NU7 (October 2025) added PQ signatures even for t-addresses. A ready-made "quantum safe" without migration.
Quantum Resistant Ledger (QRL): Fully XMSS/SPHINCS+ since 2018. PoS migration in Q1 2025; +33% growth in June. Ideal for a "Y2Q" hedge.
IOTA: Lattice + hash chain without ECDSA. IoT focus; resistant to NISQ computers.
Nervos Network: CKByte with PoW + QR scaling for dApps.
Algorand (ALGO): Falco/Dilithium in signatures; fast migration.
Hedera (HBAR): SPHINCS+ hash-based; enterprise focus.
Starknet: Poseidon hash (QR primitives); v0.14.0 in September 2025.
Ripple (XRP): Dilithium in 2025; for cross-border payments.
Cardano: Q-Index group; PQ wallets 2025–2026.
Internet Computer (ICP): ZK + lattice since 2021; Groth/Cerulli plans.
Major Networks in the Adaptation Process
Industry giants are forced to invest in PQC solutions:
Bitcoin (BTC): The community is developing BIP-360 (P2QRH), which proposes the implementation of hybrid signatures (a soft fork combining ECDSA and ML-DSA) to ensure gradual but mandatory migration.
Ethereum (ETH): The project is investing heavily in R&D ($32.6 million), testing Dilithium and STARKs through initiatives like EIP-7932.
Assets in Urgent Need of Migration:
Monero (XMR): Despite the high level of anonymity provided by Ring Signatures and Ring Confidential Transactions (RingCT), Monero uses ECDSA for its underlying transaction digital signatures. This makes it vulnerable to Shor's algorithm. A successful PQC migration will require a comprehensive upgrade to integrate post-quantum signatures without breaking existing cryptographic privacy primitives.
Dash (DASH): Like most altcoins, Dash uses ECDSA for transaction signing. While its InstantSend and PrivateSend features improve speed and coin mixing (CoinJoin), they do not provide quantum resistance. Dash will also face the need for a forced soft fork to implement hybrid PQC signatures to protect users' assets from future attacks.
Therefore, survival is guaranteed for those projects that are either initially built on a PQC foundation or successfully migrate, replacing ECDSA with NIST-standardized PQC algorithms.
Zcash: A Ready Bridge for Migration Today
Zcash is one of the migration leaders. Its shielded pool (z-addresses), implemented after the NU5 (2022) and Halo 2 updates, is already quantum-resistant (thanks to the BLS12-381 curve). This allows it to be used as a "quantum safe" to protect assets transferred across bridges.
🔄 Migration: Technological Inevitability and the Cost of Transition
The transition to post-quantum cryptography (PQC) is critical for the survival of blockchains. This task has become a priority not only for the crypto community but also for institutional players such as BlackRock, which manages large Bitcoin ETFs.
Standardization and Protocols
A central element of the migration is the standardization of PQC algorithms:
NIST Standards: The US National Institute of Standards and Technology (NIST) finalized key PQC algorithms (FIPS 203–205) in 2025. These include Kyber (for key exchange), Dilithium, and SPHINCS+ (for digital signatures).
Bitcoin (BIP-360): A soft fork of BIP-360 (Pay to Quantum Resistant Hash, P2QRH) is proposed to implement hybrid signatures (ECDSA + PQC, e.g., ML-DSA). This scheme ensures backward compatibility during the transition period.
Bitcoin Migration Phases (Lopp, 2025): The transition will be gradual and mandatory:
Phase A: Banning spending from the most vulnerable P2PKH/SH addresses; reserving block space for "rescue" transactions.
Phase B (2 years): Completely blocking spending via legacy ECDSA signatures. Assets in unmigrated addresses will be "burned" (QRAMP).
Phase C: BIP-39 Proof-of-Possession for final activation.
Process and Timing
Activation of such changes (e.g., via UASF/BIP9, like SegWit) is expected in 2025-2026. Ethereum is following a similar path with the EIP-7932/Dilithium testnets. Zcash, as mentioned, has already partially completed the migration.
However, the key challenge lies in manual migration:
Manual Work: Only wallets and exchanges can automate the process. Regular users will have to manually transfer their coins to new P2QRH addresses (e.g., bc1r...) or QR-resistant pools (e.g., Zcash z-addresses).
Grace Period: The expected grace period for transfers is 3-5 years (until 2026-2030). After this period, funds remaining in old addresses will become vulnerable or be locked.
Losses and the Cost of Inaction
The cost of inaction will be inevitable financial losses:
Loss Percentage: Deloitte estimates that 20-35% of the total Bitcoin supply (5-7 million coins, including Satoshi's holdings and long-lost coins) is held by addresses that will not be able to migrate or will not have time to do so.
Complete Crash: Low-liquidity or low-activity blockchains that fail to achieve consensus for migration may be completely wiped or frozen.
Migration is a complex technological soft fork that requires coordinated action from developers, exchanges, and users. Success guarantees the preservation of assets, while failure leads to their irreversible loss.
USDT and USDC: Stablecoins at the Forefront
Stablecoins are also vulnerable because they use ECDSA chains (Tron/Ethereum). Tether (USDT), with a market cap of $155 billion (2025), is actively migrating to Dilithium. However, USDC (Circle), which is regulated and actively adopting PQC standards (e.g., Algorand and Hedera), is positioned as a more stable leader in the post-quantum world.
🚀 The Endgame: A Hybrid Post-Quantum World
By 2030, Q-Day will likely strike, but by then the market will already be hybrid. Bitcoin will survive, but with losses; Zcash, QR, IOTA, and other QR-based cryptocurrencies will become beacons of security. The financial sector will rely on quantum-resistant stablecoins (USDC, XRP stablecoins). The success of migration will depend on user vigilance: if you don't migrate, you lose.

LongAccording to the analysis of the waves and the help of the Gann method, it can be expected that the price will return to the green zone again.
This is my personal opinion. Please don't use it as your trading criteria. Good luck

$XRP Holding the Line?BINANCE:XRPUSDT CRYPTOCAP:XRP Holding the Line?
XRP is consolidating in a tight range after a strong rebound, currently testing key support at ~$2.10.
The trend looks bullish short-term if it holds here—volume spikes suggest accumulation, not capitulation.
Breakout above $2.55 resistance could target $2.70-$2.85 next, fueled by momentum.
But watch for a deeper dip to $1.95 if support cracks on low volume.
Key indicators: RSI at 55 (neutral, room to run), 50 EMA as dynamic support, and rising MACD histogram.
Stay vigilant! 📈🔍
#XRP #CryptoAnalysis #TradingView

Nasdaq Approves Spot $XRP ETFThe first spot CRYPTOCAP:XRP ETF (ticker:XRPC) is scheduled to go live today, signaling another step forward for the broader crypto-ETF market.
This marks a major legitimacy boost for XRP—something the asset hasn’t seen in years. Whether it becomes a true catalyst now depends on one thing: sustained inflows.
TECHNICAL VIEW:
CRYPTOCAP:BTC continues to dictate broader market direction, while XRP remains stuck in a multi-month range. The structure still leans bearish, with a clear sequence of lower highs showing that momentum has yet to return.
CRYPTOCAP:XRP is currently ranging between $2.06 and $2.70, with the upper boundary holding as firm resistance. Price made an attempt to break through the liquidity curve, but if price just stall here without a decisive break above $2.60, then we do have a risk of breaking down into $1.80-$1.70 zone.

XRPUSDT UPDATE#XRP
UPDATE
XRP Technical Setup
Pattern: Falling Wedge Pattern
Current Price: $2.49
Target Price: $3.80
Target % Gain: 52.61%
Technical Analysis: XRP is forming a falling wedge pattern on the 1D chart, suggesting bullish momentum is building. The price is approaching the upper resistance trendline and is expected to break out soon. A successful breakout, supported by volume expansion, could push XRP toward the $3.80 zone, aligning with previous structural highs.
Time Frame: 1D
Risk Management Tip: Always use proper risk management.
Next volatility period: Around November 26
Hello, traders!
Follow me to get the latest information quickly.
Have a great day!
-------------------------------------
(XRPUSDT 1D chart)
Currently, the M-Signal on the 1W chart > Price > M-Signal on the 1D chart > M-Signal on the 1M chart.
Additionally, it is attempting to break above the StochRSI 80 indicator.
Therefore, if it finds support near the StochRSI 80 indicator and rises, it is highly likely to enter an uptrend.
The resistance zone is around 3.4037-3.4540, which is the HA-High ~ DOM (60) range.
The above is an interpretation based solely on the 1D chart.
-
The chart above displays support and resistance points drawn on the 1M, 1W, and 1D charts.
This indicates that support and resistance have formed in the 2.9092-3.0361 range.
Therefore, we have identified a zone where we can execute a two-stage sell-off.
This confirmation will be crucial for maintaining a stable psychological state amidst price volatility.
If the price falls to the 1.5-1.9669 range, which is the most important level for maintaining an uptrend, you should watch for an explosive increase in trading volume.
If it shows support, it indicates a buying opportunity.
-
Thank you for reading to the end.
I wish you successful trading.
--------------------------------------------------

XRP / USDT (4H Timeframe)Pattern: Hammer Reversal + Demand Zone Accumulation Setup
The chart shows XRP reacting strongly inside a key demand zone, where the past 2–3 candles are showing clear buying pressure.
Maybe Price is collecting buying orders in this zone, forming a hammer candlestick that signals a potential reversal.
Key Observations
🔹 Accumulation in Demand Zone: Last 2–3 candles show buyers absorbing sell pressure and quietly building long positions.
🔹 Hammer Candlestick: Long lower wick indicates aggressive buying after a liquidity sweep into demand.
🔹 Demand Zone: $2.2415–$2.2830 — strong reaction area where buyers previously stepped in.
🔹 Order Collection: Price behavior suggests smart money collecting buy orders before attempting a move upward.
🔹 Market Structure: Short-term downtrend but showing early bullish reaction signs.
🔹 Supply Zone: $2.9797–$3.0546 — major resistance where strong sell orders remain.
Potential Move
If XRP continues holding above the $2.24–$2.28 demand zone, potential upside targets:
🎯 Target 1: $2.5200
🎯 Target 2: $2.7200
A 4H candle close below $2.24 would weaken and likely invalidate the bullish scenario.
Summary:
XRP is showing early signs of accumulation inside its demand zone, with the past few candles reflecting steady buying pressure. The hammer formation suggests a possible reversal, but the outcome depends on whether buyers continue defending the zone. Holding above demand keeps targets of $2.52 and $2.72 in play.

XRP/USDT — Reversal Incoming or Deeper Breakdown?XRP is now standing at a make-or-break point. After weeks of movement inside a well-defined descending channel, price is once again testing the critical support zone at 2.32–2.17 — the level that has repeatedly acted as the last line of defense for the bulls.
This zone has held multiple times, yet each bounce has been capped by the upper boundary of the channel — forming a classic corrective structure where bearish momentum gradually weakens, preparing for a potential breakout phase.
---
📊 Pattern & Technical Structure
The chart reveals a descending channel pattern, typically signaling a corrective or consolidation phase within a broader market cycle.
Lower boundary of the channel → potential accumulation area and source of rebound.
Midline → dynamic resistance that has repeatedly rejected upward attempts.
Support box 2.32–2.17 → the decision zone, where bulls and bears will soon reveal the next major trend.
Failure to hold this level could trigger another leg down, while a strong defense here could mark the beginning of a larger trend reversal.
---
🚀 Bullish Scenario
A bullish breakout setup will be confirmed if:
1. Price closes above the descending channel with strong daily momentum.
2. The breakout is followed by a successful retest of 2.75 as a new support.
3. Upside targets then lie at 3.09 – 3.32 – 3.56 – 3.66, representing potential wave extensions.
If validated, this move could trigger a powerful recovery rally and possibly signal a major bullish reversal on the higher timeframes.
---
🔻 Bearish Scenario
On the flip side, if the 2.17 support fails to hold and a daily close occurs below this zone, then:
Price could continue sliding toward the lower boundary of the channel (1.95–1.80),
Extending the correction phase,
And potentially forming a lower-low structure in continuation of the broader downtrend.
This would confirm a sustained bearish control in the medium term.
---
📍 Conclusion
XRP is at the edge of compression, where the next decisive move will define its next big trend.
This descending channel may soon reveal whether it’s a bear trap before a breakout, or the start of another downward leg.
The reaction at the 2.32–2.17 zone will decide everything — this is the battlefield between reversal and breakdown.
Watch for daily closes, volume confirmation, and price behavior around the upper boundary of the channel.
Smart traders know — the calm before the breakout is where the biggest opportunities are born.
---
#XRP #XRPUSDT #Ripple #CryptoAnalysis #TechnicalAnalysis #DescendingChannel #PriceAction #SupportResistance #CryptoBreakout #SwingTrade #ChartPattern

BTC LONGS!!The Crypto Market Is Pulling Back… But This Changes Nothing! Im looking for longs on BTC!!
In this video, I break down the current crypto move to the downside and why I still believe this is a healthy pullback, not the start of a bearish trend. I’ve been talking about this setup for weeks — and it’s unfolding exactly as planned.
Here’s what I cover:
-Analysis of Total Market Cap, BTC, ETH, and XRP
-CME Gap finally filled — what that means for price action
-Why this could be the perfect area for high-risk long setups
-What I’m looking for next and how I’m planning my next trades
⚠️ Disclaimer:
I am not a financial advisor. The content shared on this channel is for educational and informational purposes only and should not be considered financial advice.
Trading and investing in cryptocurrency involve high risk — you could lose some, or all, of your money. Always do your own research and make sure you understand the risks before making any financial decisions.

XRP Downward Move Incoming? Market Manipulation at Play?I’m watching XRP closely on the 1H chart, and something feels off. This recent push up looks like a liquidity grab — classic manipulation to trap late long entries before a potential reversal.
The structure still shows lower highs forming, and we haven’t reclaimed key resistance levels convincingly. I believe we could see a move down from current levels, possibly retesting the demand zone below before any sustainable bounce.
Let’s see how it plays out — stay patient, stay sharp, and don’t get caught in the trap.
📉💡

$XRP Trendline Breakdown – Support Crucial for Reversal?BINANCE:XRPUSDT CRYPTOCAP:XRP Trendline Breakdown – Support Crucial for Reversal?
Current trend: XRP's in a bearish slide along the descending trendline, now testing the 2.39 support after rejection from 2.59 highs—sellers in command, but thinning volume suggests potential exhaustion 🛡️.
Hold support? Even odds yes; prior bounces and EMA confluence could ignite a sharp rebound if buyers defend the zone.
Breakout above resistance? Needs 2.59 close to flip trendline bullishly—could rally 5-7% to 2.70 if BTC stabilizes 🚀.
Dip risk? Elevated to 2.30 on break, accelerating downside momentum.
Target: Bounce to 2.50 on hold; downside 2.25 buffer.
Indicators tracking: RSI (38, oversold territory), Trendline integrity, and MACD bear divergence 📉.
#XRPTrading #CryptoSupport #AltcoinPioneers

$XRP Resistance Test – Breakout Incoming?BINANCE:XRPUSDT Resistance Test – Breakout Incoming?
XRP's 1H chart building bullish momentum, probing resistance at 2.583 after solid bounce from support ~2.50—break above targets 2.65, but watch for rejection dip to 2.45 if volume dips.
Strong uptrend holds.
Key indicators: RSI at 65 (bullish), 50MA support intact, MACD histogram expanding. 🚀💥
#XRP #Ripple #AltcoinPioneers

$XRP Support Siege – Flip to Bulls on Hold?BINANCE:XRPUSDT CRYPTOCAP:XRP Support Siege – Flip to Bulls on Hold?
Current trend: XRP's in a corrective slide, probing the sturdy 2.31 support after topping out near 2.56 resistance—low-volume wicks suggest exhaustion, with alts eyeing a relief rally 🛡️.
Hold support? Solid odds yes; doji formations and volume pickup on greens signal buyers loading up for defense.
Breakout above resistance? On deck if closes over 2.56—could spark 5-7% rip to fresh highs 🚀.
Dip risk? Low-moderate to 2.25 on BTC drag, but MACD divergence limits downside.
Target: Near-term 2.55 retest, then 2.70 if momentum flips.
Indicators tracking: MACD for crossover signals, RSI (hovering 42) for oversold snapback, and VWAP as pivot 📊.
#XRPTrading #AltcoinRebound #CryptoSupport

XRPUSDT 1D#XRP is moving inside a bullish flag on the daily chart. Consider buying around the support zone. For the bullish scenario, the price must hold inside the flag; therefore, two consecutive daily candle closes below the flag will invalidate this analysis.
In case of a successful bounce from the support zone, the short-term target is:
🎯 $2.5777
And in case of a breakout above the daily SMA200 and the flag resistance, the next potential targets are:
🎯 $2.7845
🎯 $2.9913
🎯 $3.2471
🎯 $3.6607
⚠️ Always use a tight stop-loss and apply proper risk management.

XRPUSDT 30min Longs 🔵 Market Structure
Break of Structure (BOS): Above 2.4283 confirmed
Liquidity Sweep: Below 2.4019 before push upward
🟡 ICT Concepts
⚡ Trade Setup
Long Entry: 2.4150-2.4200 (current pullback)
Stop Loss: Below 2.3980 (FVG break)
Targets :
TP1: 2.4500-2.4750
TP1:2.5200-2.5700
Bullish structure intact - buying dips for liquidity grab above
#XRP #SMC #ICT #TradingView #Bullish

XRPUSDT.P - November 12, 2025XRPUSDT.P is showing potential for a short-term bullish reversal after stabilizing near the $2.3779 support zone. The pair is attempting to break above a descending trendline, which has contained price action throughout the recent downtrend. A confirmed breakout and sustained move above the $2.4399 resistance level could signal renewed buying interest. If momentum builds, price action may target the $2.5758 profit level, representing the next key upside objective.
The stop level is positioned around $2.3148–$2.3200, marking the invalidation area for this bullish setup and protecting against a deeper correction.
Risk Assessment: Moderate to High — While early signs of a trend reversal are forming, XRPUSDT.P remains within a broader bearish structure. Failure to hold above the $2.38 zone or rejection from the trendline could trigger a renewed selloff toward $2.32 or lower. Confirmation above $2.44 is essential for a stronger bullish case.

XRPUSDT.P - November 13, 2025Testing out the sell signal generated by my personal minimalist buy and sell signal indicator (signals by miljedtothemoon v1) on the XRPUSDT.P (5-minute chart).
Yesterday, the indicator printed two winning trades — one on a buy (long) signal and one on a sell (short) signal. Let’s see if it works out today.
Disclaimer: This tool is still a work in progress and not 100% reliable. The signals can be high-risk and may produce false entries or exits.
This is for personal and educational purposes only — not financial advice, an advertisement, or a promotion.
