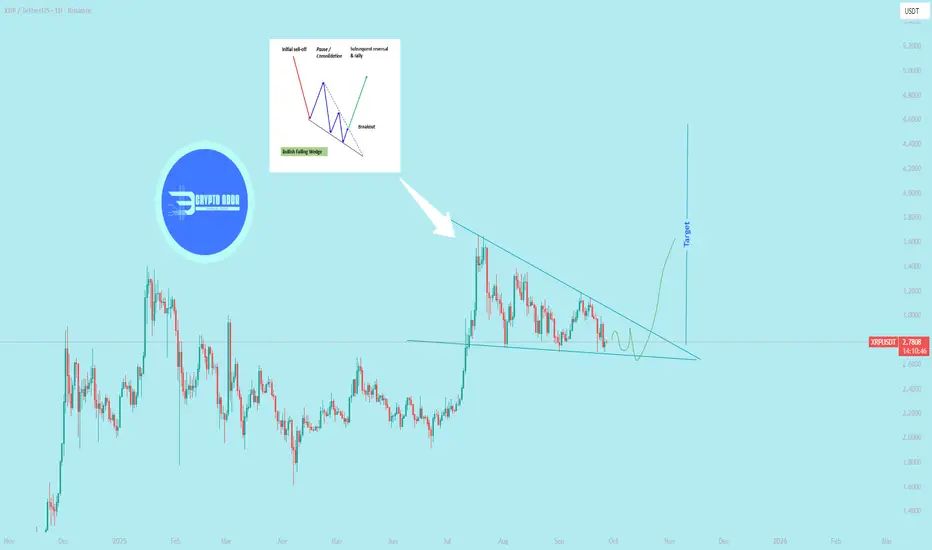
$XRP Performing falling wedge pattern in 1D
> Falling wedge as a reversal vs. continuation pattern
`As a reversal pattern`
`Location:` Occurs at the end of a prolonged downtrend.
Signal: The narrowing price action and declining volume suggest that sellers are exhausting their momentum. The pattern is completed when the price breaks above the upper resistance line, signaling a potential bullish reversal.
`As a continuation pattern`
`Location: `Appears after a strong uptrend.
Signal: The falling wedge acts as a temporary consolidation or pause in the current trend. The price then breaks out to the upside, continuing the original uptrend. @everyone
XRPUSDT.P trade ideas
Forecast for XRPUSDT 29th September 2026Expectation of a minimum 10%+ Move to the Upside for XRP. Explosive move suggested by BBWP Indicator. XRP often moves with relatively increased velocity and magnitude compared to other large cap altcoins, so whilst a minimum 10% move is expected, it may likely move even more.

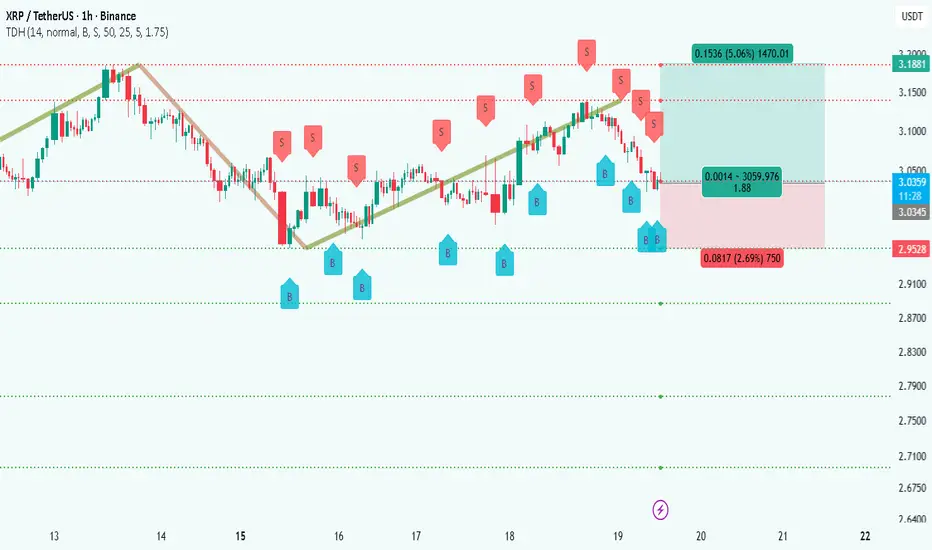
XRPUSDT Bullish Scenario Updated🔎 Technical Outlook
XRP is currently trading around 3.03 – 3.04 USDT, after bouncing from a key support zone near 2.95 USDT. The chart shows a sequence of higher lows with multiple buy signals clustering near the base, suggesting strong accumulation.
The resistance zone sits around 3.18 USDT, which is also marked as your target area. A clean breakout above minor intraday resistance at 3.05 USDT would open the way for bullish continuation. The structure favors buyers as long as price holds above 2.95 support.
________________________________________
📈 Trade Setup (Bullish Bias)
• Entry: 3.03 – 3.05 USDT (current market zone)
• Stop-Loss: 2.95 USDT (below recent support & invalidation level)
• Take Profit 1: 3.12 USDT (intermediate resistance)
• Take Profit 2: 3.18 USDT (major resistance target)
• Risk/Reward: ~1:2
________________________________________
🛡 Risk & Trade Management
• 🔒 Partial Profit Booking: Secure some profits at 3.12 USDT to reduce risk exposure.
• 📈 Trailing Stop: Once TP1 is hit, move stop-loss to breakeven (3.03) and trail along higher lows to ride momentum.
• 🚫 Invalidation: If XRP breaks below 2.95, the bullish setup is invalid, and exiting quickly protects capital.
________________________________________
✅ Summary
XRP is showing bullish intent after defending the 2.95 support zone and looks set to retest 3.12 – 3.18 USDT. A layered profit-taking approach with a trailing stop allows you to capture the move while managing downside risk effectively.
________________________________________
XRP Update📊 CRYPTOCAP:XRP Update
If XRP moves back to the red resistance zone, wait for confirmation before entering a short position. ⚠️
This is the zone where sellers could step in again and push the price down from this level. 📉

XRP - 1D Elliott Wave Analysis - 28.09.25Welcome
We assume that the low on the 7th of April formed the green Wave 4 and we are since then working on the green Wave 5 which is the last Wave to the upside of this bullmarket for XPR.
We have already formed the blue Wave 1, 2 and most likely 3 of the green Wave 5 and we are working on the blue Wave 4. The green Wave 5 appears to be an ending diagonal.
We are still working on the blue Wave 4 which currently we count as an WXY in red of which we finished Wave W and X and are working on Y. Wave Y would unfold as ABC. The Wave 4 support area lies between the 0.5 FIB at 2.6350 USD and the 0.786 FIB at 2.1909 USD. The next targets to the downside for Y are the 2.5160 USD and the 2.3728 USD price level depending on the count and measurement. The 2.4161 USD price level is also interesting as it is the point of control of the previous price action which could function as additional support as well as the white trendline that we have going through the support area.
Thanks for reading.
NO FINANCIAL ADVICE.

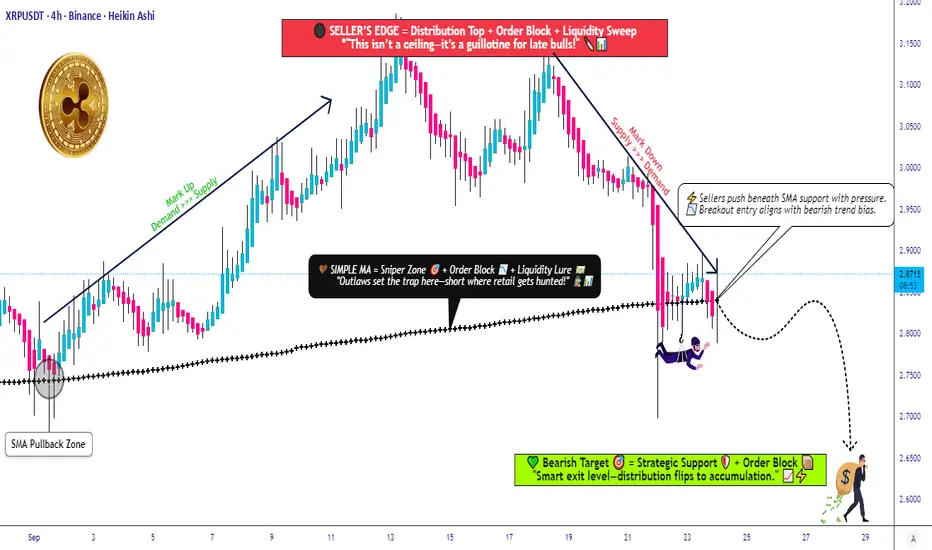
Ripple vs Tether: Key Technical Levels Every Trader Should WatchXRP/USDT | "RIPPLE vs TETHER" Market Wealth Strategy Map (Swing/Day Trade)
📊 Plan:
We’re eyeing a bearish confirmation if candles break below the 0.786 Fibonacci zone + SMA breakout @ 2.8300. At that point, sellers could gain momentum and dominate short positioning.
💡 Thief Strategy Highlight → Using a layered entry style (multiple limit orders). This method allows staggered entries rather than “all-in at once.”
🎯 Layered Short Entries (Sell Limits):
2.9300
2.9000
2.8800
2.8600
(You can expand layers based on your own strategy adjustment.)
🛑 Stop Loss (Thief SL):
Placed near 3.0000 — but ⚠️ please note: Risk management is personal. Thief OG’s — make your own choices. My SL is just an example.
✅ Target (Thief TP):
The “police barricade” (aka strong resistance zone with overbought pressure + possible trap) aligns around 2.6500. That’s where profit-taking may be wise before liquidity hunters catch us.
Again, this is flexible — adjust TP to your own risk/reward plan.
🔗 Related Pairs to Watch
$BTC/USDT → Major market leader, XRP often follows Bitcoin’s momentum.
$ETH/USDT → Correlation with altcoin sentiment; strong ETH moves ripple across XRP.
$ADA/USDT & $SOL/USDT → Competing Layer-1s, often mirror similar retail/institutional flows.
$XLM/USDT → Direct cousin of XRP, highly correlated in macro movements.
Watching these can help confirm broader market bias & correlation flows.
✨ “If you find value in my analysis, a 👍 and 🚀 boost is much appreciated — it helps me share more setups with the community!”
⚠️ Disclaimer: This is a Thief style trading strategy shared just for fun & community engagement. Not financial advice. Manage your own risk, make your own decisions.
#XRP #Ripple #CryptoTrading #SwingTrade #DayTrading #Fibonacci #TechnicalAnalysis #CryptoCommunity #TradingStrategy
XRP Faces Bearish Momentum as MACD Crosses DownXRP/USD’s one-day chart shows a bearish MACD crossover, signaling that the token has entered a renewed downtrend.
The MACD, a key momentum indicator, generates sell signals when its line crosses below the signal line, indicating fading upward momentum.
This is XRP’s first bearish crossover since September 8, reflecting a shift in market sentiment from bullish to bearish and suggesting that traders may reduce positions.
Adding to the negative outlook, XRP has dropped below its 20-day exponential moving average (EMA), which now acts as dynamic resistance at $2.97. The 20-day EMA emphasizes recent price action, and trading below it typically signals rising short-term selling pressure.
Together, the MACD crossover and the EMA breach indicate that XRP could face further downside in the coming trading sessions, keeping the altcoin’s performance under pressure.

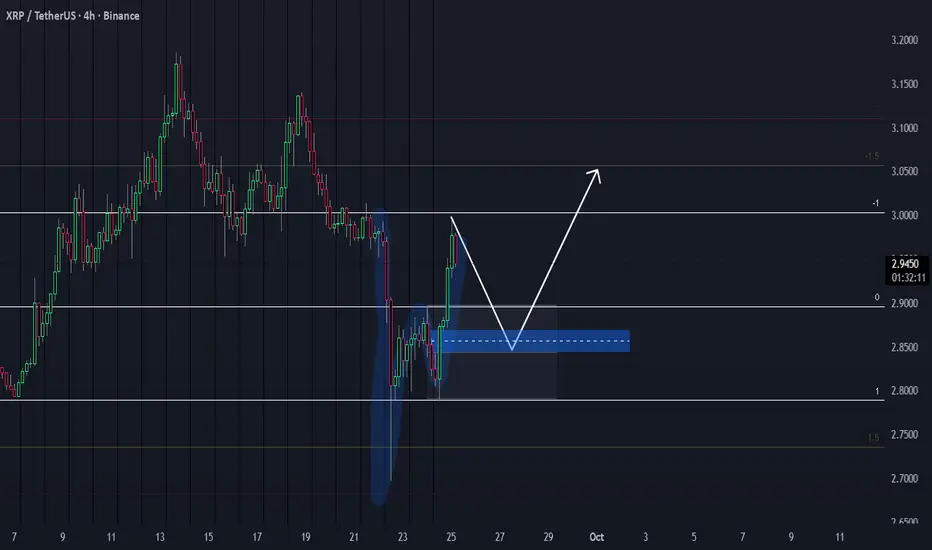
XRP 4H Flash Model, long setupFlash Model, long setup.
Price swept liquidity + broke structure. Now it’s retracing into demand.
The play is simple: If there’s a clear imbalance, target the imbalance.
Invalidation = break under demand.
All the best
$XRP 4-HR: bearish Market Structure, bullish Gartley nullifiedCRYPTOCAP:XRP has turned completely BEARISH on the 4-HOUR chart after a series of lower lows and lower high. Market Structure is King. I do not hold longs when market structure is bearish.
And you should not either, unless you hate money, of course.
So below horizontal support/resistance zone, below both 50 & 200 moving averages (and yellow 50 MA about to cross below green 200 MA, that would be a DEATH CROSS).
This CRYPTOCAP:XRP could look very ugly if we see a breakdown below the DOUBLE BOTTOM formed during the flashcrash two days ago.
A potential BUY ZONE is again around the $2.7 mark, this support has worked many times already.
Let's see of the #XRPArmy saves this coin from falling from the cliff.
Btw, bullish Gartley Harmonic pattern has also failed, so everything is looking not very healthy.
I'm happy to have closed the long, in other words👽💙

$XRP in price RECOVERY after hitting a DOUBLE BOTTOM supportOk, a proper view for CRYPTOCAP:XRP since I got into a long position a few hours ago.
Hit support at $2.70 clearing the main cluster of late liquidations there and forming a double top with a neckline at $3.18.
Most of the liquidity is now just above $3.1, so there is a reason for this price to go 10% from here.
Entered at $2.82, now monitoring on smaller timeframes as crypto markets look rather weak with CRYPTOCAP:BTC dominance chart climbing up again.
So, this is a classical rebound trade, and I cannot pretend not to expect further violence, but #xrp is looking very good on the XRP versus CRYPTOCAP:ETH chart too, so that's why I'm in this long.
Stop loss always on, and you do you💙👽

XRP Technical Setup | Bullish Confirmation or Resistance Trap?🕵️♂️ XRP/USDT – "RIPPLE VS TETHER" Wealth Strategy Map 💰⚡
Idea Type: Swing/Day Trade
Market Mood: Bullish confirmed ✅
📊 Plan Breakdown
📈 Setup: Bullish bias confirmed with TMA (Triangular Moving Average) breakout ➕ pullback.
🕯️ Extra Confirmation: Heikin Ashi Doji → Bull Reversal spotted.
🎯 Execution Style: Thief Strategy = Layered limit order entries (stealthy stacking style).
🎯 Entry Plan (Layering Method)
Multiple buy layers placed around these zones:
💎 3.0400
💎 3.0600
💎 3.0800
💎 3.1000
🔑 Traders can add or reduce layers depending on personal risk preference.
🛑 Stop Loss (Thief’s Shield)
Suggested defense line around 3.0000.
⚠️ Note to Thief OGs: SL is personal. Manage risk wisely, protect your capital.
🎯 Target (The Escape Plan 🚪💨)
Overhead zone = Electric Shock Fence ⚡ (major resistance + overbought trap).
Suggested escape target: take profit before getting trapped at resistance zone.
⚠️ Reminder: Not financial advice — adapt targets to your style.
🔍 Related Pairs to Watch (Correlation Check)
💵 BITSTAMP:BTCUSD → Bitcoin often leads XRP momentum.
💵 BITSTAMP:ETHUSD → Ethereum trend can mirror altcoin sentiment.
💵 COINBASE:XLMUSD → Stellar has historic correlation with XRP moves.
💵 CRYPTOCAP:USDT.D (Tether Dominance) → Watching stablecoin flows gives clues about liquidity shifts.
👑 Thief Notes:
Dear Ladies & Gentlemen (Thief OG’s) 🕶️💼
This map is for educational & strategic illustration.
I’m not recommending you to strictly follow my SL/TP.
Manage your own layers, steal the opportunity, and escape with your own timing.
✨ “If you find value in my analysis, a 👍 and 🚀 boost is much appreciated — it helps me share more setups with the community!”
#XRP #XRPUSDT #Crypto #CryptoTrading #SwingTrade #DayTrade #LayeringStrategy #HeikinAshi #TMA #Altcoins #ThiefTrader

XRP/USDT on the 15 Minute. Bullish divergence.On the XRP/USDT 15 min. I see bullish divergence on the MACD and RSI. An inverse H/S pattern is forming nicely on the 5 min. Target for Long 3.0052 USDT.

XRPUSDT: A Long Opportunity You Can’t MissXRPUSDT is looking pretty interesting right now. The price has broken through the nearest resistance level and has come back to retest it. Classic breakout and retest setup.
The price got rejected from that level, turning it into a new support zone. This is a solid long signal. My target is 3.3828.
What do you think?

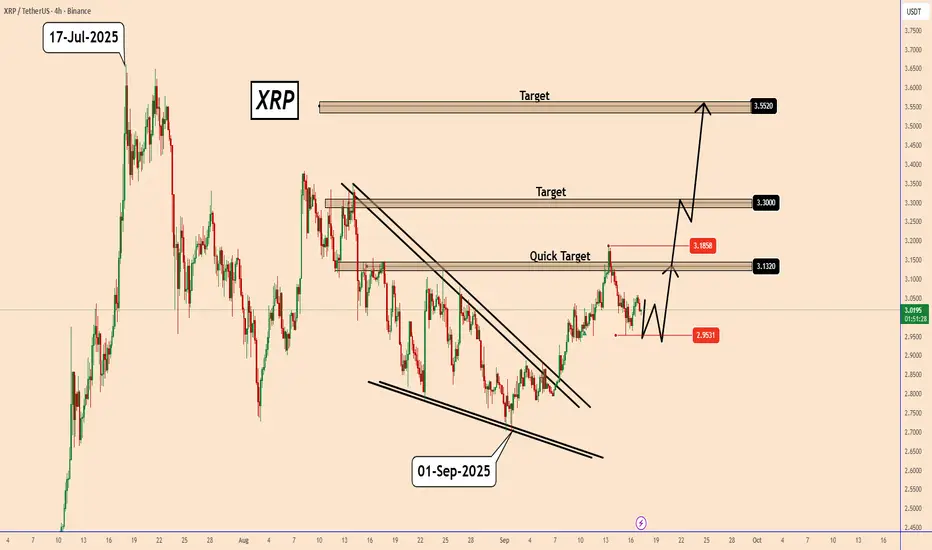
XRP Analysis – Watching Key Levels Ahead of FOMCXRP Analysis – Watching Key Levels Ahead of FOMC
As per our previous analysis, XRP broke through the first target and reached 3.18. The bullish move was followed by a sharp correction down to around 2.95.
Today, XRP confirmed another bullish pattern. If it holds ahead of the FOMC meeting, the price could rise again in line with our earlier forecast.
⚠️ Trading during major events is very risky, don’t forget that.
I’m watching the next key targets: $3.13, $3.30, and $3.55.
You may find more details in the chart!
Thank you and Good Luck!
❤️PS: Please support with a like or comment if you find this analysis useful for your trading day❤️
XRPUSDTAccording to the chart, there are no clear signs of a structural change in the overall price trend. In the upper timeframe, we do not have any lower lows than the previous major lows, and this will be a sign of a continuation of the upward trend until we see a lower low than the previous major low.
In the lower timeframe, the price is in a descending channel, where I do not see any scary selling pressure.
The 2.5 range is an important and valuable range.
If the price reaches this range, we need to see what reaction it will show.
Pay attention to the red box, which is similar to the current price behavior.

XRP; The double top pattern is fake!!!Hello friends
Regarding the price channel we had, after a long time this channel has been broken and now a double top pattern has formed which looks fake and wants to trap sellers.
If the price continues to move upwards, it can move to the specified areas.
If the formed pattern really wants to act and we have a price drop, the bottom of the channel and its midline are good supports.
*Trade safely with us*
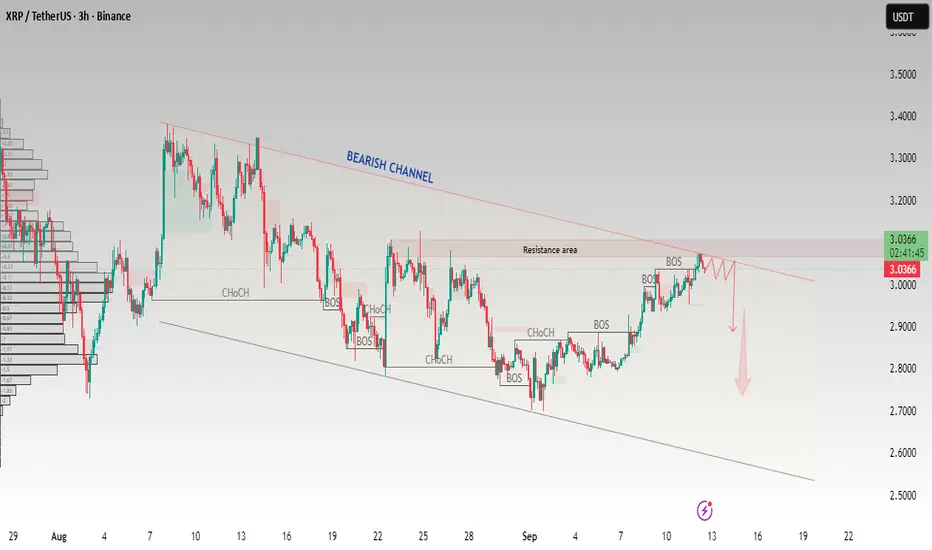
XRP/USDT – Testing Resistance Inside Bearish ChannelXRP is trading within a clear bearish channel and has reached the resistance area near 3.05 – 3.10. Price is showing rejection signs from the upper boundary of the channel, which may trigger a downside move if sellers hold control.
Key Points:
Bearish channel structure in play
Resistance zone: 3.05 – 3.10
Potential rejection at channel top
Downside target zones: 2.90 and below
This setup favors bears as long as XRP remains below the channel resistance. A confirmed breakout above resistance would invalidate the bearish view.
This analysis is for educational purposes only and does not constitute financial advice. Trading cryptocurrencies carries high risk; please trade responsibly and use proper risk management
XRP/USDT – Bullish Breakout With 35% Upside PotentialCRYPTOCAP:XRP on USDT market pair is showing good strength here after finally breaking out of that descending trendline resistance that’s been holding since mid-July (57 days).
We also had a falling wedge breakout and price is now consolidating just above the old resistance, which has flipped into support. That’s usually a strong continuation sign.
The retest around $2.90–$3.00 held up perfectly, lining up with the 100 EMA, which makes that zone solid support.
I’m watching $3.35 and $3.68 as the first targets as long as its above demand zone.
Bigger picture, XRP could stretch toward $4.02 (around +35% from here), which lines up with the mid-range resistance from earlier in the year.
What do you think? Alts season looming?
#XRP #ALTSEASON

#XRP is Approaching a Breakout | Will It Hold or Collapse? Yello, Paradisers! Is #XRP about to confirm a real breakout from months of sideways pain, or is this just another trap? Let’s dissect what’s happening with precision so you’re prepared either way:
💎After weeks of compression beneath a well-defined descending resistance, #XRPUSDT is about to break out. The breakout above this key trendline is now increasing the probability of a bullish continuation, especially with the 50EMA acting as dynamic support and reinforcing the bullish pressure.
💎Currently, the price is trading around $3.00, right above the breakout zone. If the market successfully retests this descending resistance as new support and holds, this would signal strong momentum building up for the next impulsive leg.
💎If that happens, the first upside target is the moderate resistance level at $3.66. A confirmed break above that could send #XRPUSD toward the strong resistance near $4.17, which aligns with the upper boundary of the visible volume profile.
💎On the flip side, the support zone between $2.69 and $2.48 now becomes critical. A retracement into this area could provide a high-probability bounce, but any breakdown and daily close below $2.4849 would invalidate the current bullish setup. In that case, price could unwind sharply, as the bullish structure would be broken, and sellers could regain control.
Stay patient, Paradisers. Let the breakout confirm, and only then do we strike with conviction.
MyCryptoParadise
iFeel the success🌴

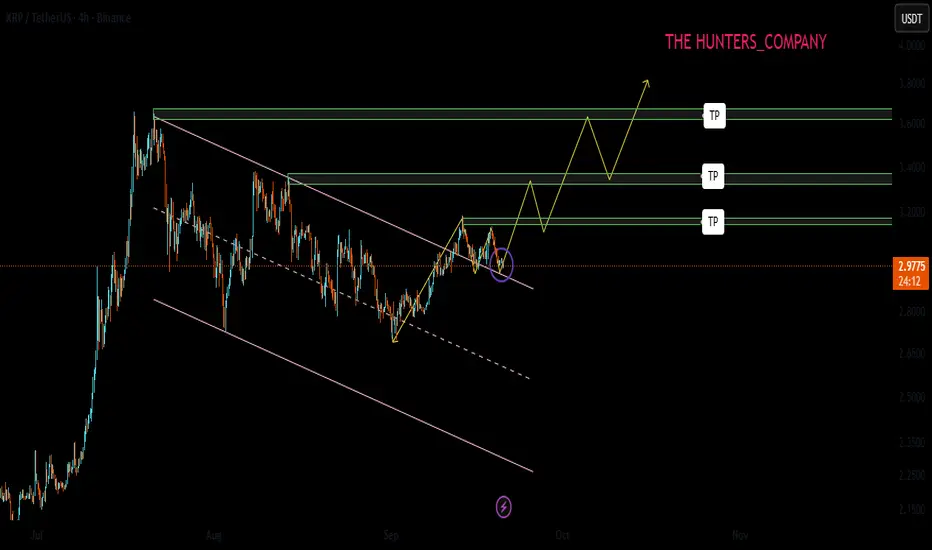
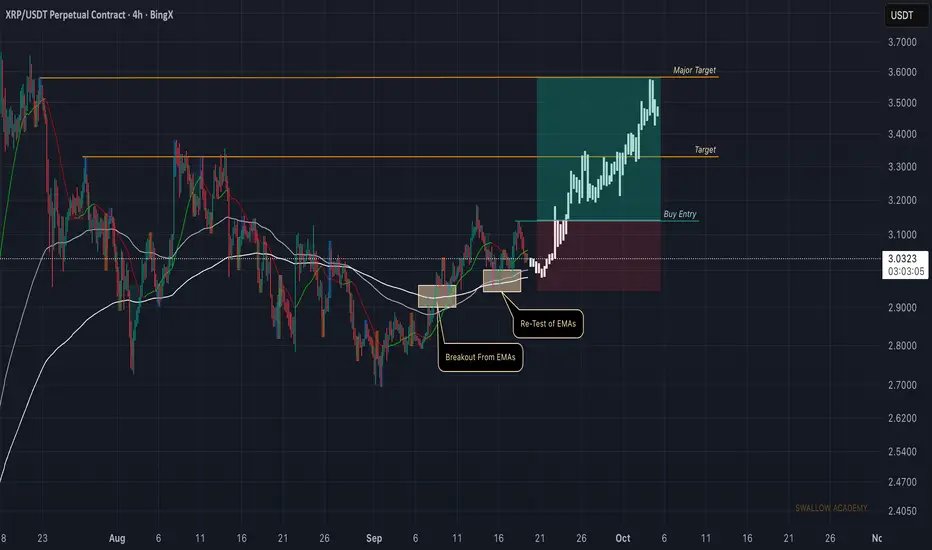
Ripple (XRP): Waiting For Proper Break of Structure | Bullish XRP has been holding well above the EMAs after the breakout, and candlesticks show steady buyer dominance with higher lows forming.
As long as sellers fail to close below EMAs, momentum should keep pushing toward the first target and eventually the $3.6 major target. Any close under EMAs would shift the structure, but for now, bulls are in control.
Swallow Academy
XRP - Small Dip Before a Big RipVery surprised at how obvious it is to read this price action on XRP, tells me there's a lot of attention/people and volatility involved with this.
Expecting to finish a small wave 4 before a decent breakout.
Overall Wave-Count Confidence: Average

XRP Price Eyes $3.75 on Bullish Chart BreakoutBINANCE:XRPUSDT price is trading close to $3.10, pressing against the neckline of an inverse head-and-shoulders pattern. This is one of the strongest reversal signals in technical analysis. The neckline sits around $3.21, and if BINANCE:XRPUSDT closes a daily candle above it, the breakout would confirm a bullish setup.
The height of the pattern, measured from the $2.69 head to the $3.21 neckline, projects a move of about $0.54. Adding that to the neckline gives a target near $3.75, which would be a fresh all-time high and about 21% above current levels.
Key support for BINANCE:XRPUSDT rests at $2.94, aligned with the right shoulder, while a fall back under $2.69 would cancel the bullish case. For now, momentum is building, and the chart shows buyers have the upper hand.
Supplementary data also backs the move: long-term holders have almost stopped selling, while short-term cohorts are adding supply. Together, technicals and sentiment give BINANCE:XRPUSDT price room to climb higher.

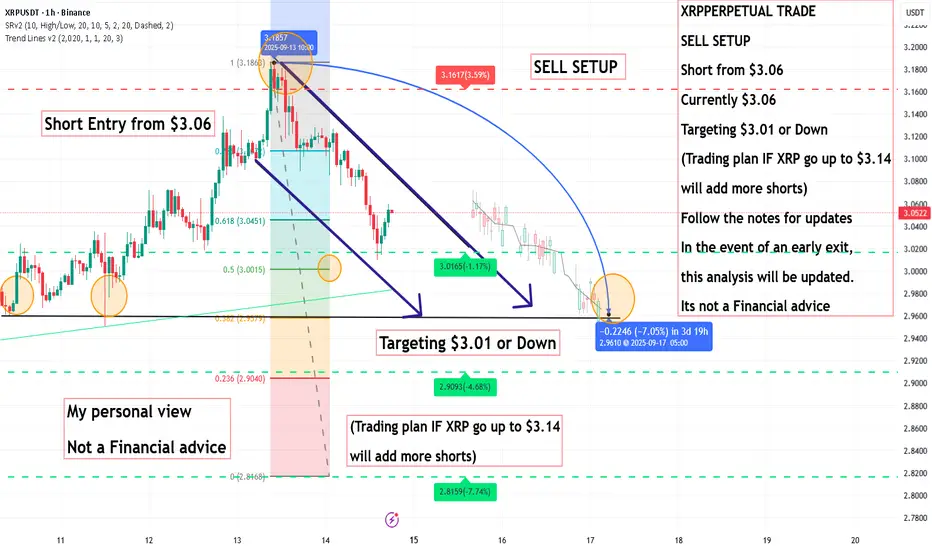
XRP PERPETUAL TRADE SELL SETUP Short from $3.06XRP PERPETUAL TRADE
SELL SETUP
Short from $3.06
Currently $3.06
Targeting $3.01 or Down
(Trading plan IF XRP go up to $3.14
will add more shorts)
Follow the notes for updates
In the event of an early exit,
this analysis will be updated.
Its not a Financial advice