$XRP: Bouncing from Support, Breakout in Sight?BINANCE:XRPUSDT CRYPTOCAP:XRP : Bouncing from Support, Breakout in Sight? 📊🚀
XRP's current 1H trend is bullish, solidly holding the main support at ~2.33 after a quick rebound—strong buyer interest here!
Expect a potential breakout above 2.61 resistance if volume spikes, targeting 2.80 next.
Low risk of deeper dip unless support cracks (possible test at 2.20).
Tracking RSI (hovering neutral ~55), 50 EMA crossover, and MACD histogram turning positive.
Stay bullish, but set stops! 💎📈
#XRP #CryptoTrading #Altseason
Trade ideas

XRPUSDT.P - November 7, 2025XRPUSDT.P is showing early signs of a short-term bullish reversal after rebounding from the ascending trendline support near the $2.16–$2.18 zone. A buy limit is positioned around $2.219, aiming for a move toward the $2.283 partial profit zone and the $2.336 profit level.
A confirmed breakout above $2.283 would validate bullish continuation, while a drop below $2.158 would invalidate this setup and signal renewed downside pressure.
Risk Assessment: Moderate — structure leans bullish, but sustained strength above the partial profit level is needed for confirmation.

how to Stop Your Money Losing Value??Have you ever felt that despite your hard work, your purchasing power is fading? This is an invisible war, a war where your cash is on the losing side. But there are practical ways to protect your assets and even grow them in the long term.
Hello✌️
Spend 3 minutes ⏰ reading this educational material.
🎯 Analytical Insight on Ripple:
XRP is testing a strong support while moving on the descending channel. A confirmed breakout with solid volume could drive a 20% rally, targeting 2.80$. 📊🚀
Now , let's dive into the educationa l section,
🛡️ Understanding the Invisible Enemy
Inflation is the primary enemy of your capital. This phenomenon slowly but surely erodes the value of your money. When the bank interest rate is lower than the inflation rate, you are effectively losing your wealth. The main goal is to find a way to achieve returns higher than the inflation rate.
🌍 The Mindset of a Preserver
The first step is to shift your mindset from a "saver" to an "investor". Your money should work for you, not the other way around. This mindset forces you to always look for opportunities that not only preserve but also increase the value of your assets.
📈 Smart Diversification
Never concentrate all your assets in one investment class. A mix of different assets such as stocks, commodities, and digital assets can form a strong shield against market fluctuations. The principle of diversification significantly reduces the risk of losing your entire capital.
⚙️ The Art of Risk Management
Preserving capital takes priority over making profits. Only enter trades with capital whose loss would not affect your current lifestyle. Setting a stop-loss for every investment position is a necessity, not an option. This protects you from negative market surprises.
🧠 Mastering Psychology
Fear and greed are two powerful and destructive emotions in the market. The fear of missing out causes you to lose golden opportunities, and greed pushes you to hold investments at price peaks. To succeed, you must overcome these emotions and stick to your strategy.
🔍 Identifying Opportunities with Trading views Tools
This section focuses on the practical search for assets with potential. Analytical tools can provide you with a better perspective for this task.
Market Scanner: Use this tool to screen thousands of assets based on specific technical criteria. You can find assets that have crossed an important moving average or are consolidating within a specific range.
Creating Charts: Create different charts for one asset and use indicators in combination. Comparing an asset's performance against others can reveal its strengths and weaknesses.
Sharing Feature: Share your ideas and analyses with the large community of users and benefit from their feedback. This helps you see hidden aspects of a situation.
🎯Top Recommendations for Action
First, have a written trading plan for yourself and do not take any action without it. Second, always withdraw a portion of your profits from the market and convert them into lower-risk assets. Third, never stop learning; markets are dynamic, and yesterday's strategies may not work tomorrow.
🚀 Final Word
Preserving the value of money is not an event; it is a continuous process. This path is paved with education, consistent analysis, and emotional control. By using the right tools and adhering to principles, you can protect your assets against inflation.
✨ Need a little love!
We pour love into every post your support keeps us inspired! 💛 Don’t be shy, we’d love to hear from you on comments. Big thanks , Mad Whale 🐋
📜Please make sure to do your own research before investing, and review the disclaimer provided at the end of each post

XRP. USDTRipple performs best on the weekly timeframe, and this is not just my opinion, all signs point to an upward trend.
ripple pushing custody as a service because when banks custody your coins on top of xrp they are not dumping they are parking. so yeah market is red but a 40b enterprise building rails around a 20 something billion token smells like future upside to me too.

Monthly Crypto Analysis: Ripple (XRPUSD) – Issue 105 The analyst expects Ripple’s price to decline by the specified end time, based on quantitative analysis.
The take-profit level only highlights the potential price range during this period — it’s optional and not a prediction that the market will necessarily reach it.
You don’t need to go all-in or use leverage to trade wisely.
Allocating just a portion of your funds helps keep overall risk low and ensures a more sustainable approach.
Our strategy is built on institutional portfolio management principles, not the high-risk, all-in trading styles often promoted on social media.
Results are evaluated over the entire analysis period, regardless of whether the take-profit level is reached.
-The validity of this analysis is based on a specific time range (until 19 Dec 2025), and after this period, the analysis will be reviewed and updated (once every 28 days).

XRP: Support Break or FVG Refill?XRP is holding inside a major support zone that’s been tested multiple times, but buyers are showing signs of exhaustion. The most recent move into the yellow FVG created an inefficiency that price often wants to revisit — but the trendline resistance above continues to cap momentum.
A push into the FVG followed by rejection would keep bearish structure intact. If the current support fails, the next liquidity draw sits much lower near the purple level, where price previously saw aggressive reactions.
Stoch RSI is trying to cycle upward, but without a strong rebound from this support, momentum alone won’t reverse the trend.
This level decides whether XRP fills the FVG and attempts a recovery — or breaks structure and seeks liquidity below.

AdvancedMA Toolkit: From Building Blocks to StrategyAdvancedMA Toolkit: From Building Blocks to Strategy Optimization
This idea explores the full ecosystem behind the
and — a complete environment
for building, testing, and optimizing moving average-based strategies.
We go beyond signals: this is about understanding market structure, parameter sensitivity, and adaptive risk management .
█ CORE PHILOSOPHY: Beyond Signals, Towards Understanding
The AdvancedMAToolkit is not a "magic indicator". It's a strategy development lab that helps you:
Build complex systems from modular MA blocks
Adapt to changing market regimes via dynamic periods
Simulate virtual trading with real-time statistics
Optimize parameters using Auto-RR and multi-objective logic
Find the best sets of strategy related options and risk/reward
Generate 2nd-layer high-conviction signals from main ones
The goal? Find robust configurations — not just high win rates.
█ THE 14 MOVING AVERAGES: When to Use Each
Each MA type has a unique personality. Here's a practical guide:
SMA — Simple Moving Average. Pure price average. Use for baseline trend in Pine Script strategies.
EMA — Exponential Moving Average. Responsive to recent price. Great for entries and momentum detection.
RMA — Relative Moving Average. Like EMA but smoother, including older data
for stable trends.
WMA — Weighted Moving Average. Weights recent bars more. Good for
momentum confirmation.
VWMA — Volume Weighted Moving Average. Volumes give accurate
market sentiment and trend representation.
DEMA — Double EMA. Effective in consolidated trends.
Used to confirm trading signals in volatile markets.
TEMA — Triple EMA. Reduced lag and noise filtering for scalping and
quick reversals.
HMA — Hull Moving Average. Smoothed EMA that reduces lag in strong trends,
responsive to price changes.
ZLEMA — Zero-Lag EMA. Minimizes delay for earlier signals on trend changes
(use cautiously in noisy markets).
FRAMA — Fractal Adaptive MA. Adapts dynamically to volatility for
adaptive smoothing.
SuperTrend — ATR-based trend filter with dynamic support/resistance.
Ideal for stop placement and trailing.
TMA — Triangular MA. Gives more weight to middle data points,
with added lag for smoother trends.
TRIMA — Weighted Triangular MA. Removes random price fluctuations
for cleaner signals.
T3 — Triple-smoothed EMA. Excellent for swing trading with minimal lag
and clean trend lines.
Pro Tip: Combine fast (HMA/ZLEMA) for entries + slow (T3/FRAMA) for trend confirmation.
█ RETEST SYSTEM: The Quality Gate
Instead of taking every crossover, wait for price to retest the MA zone :
Zone % : Distance from MA (e.g., 1.5% = tight zone)
Min Retests : 1 = quick, 3 = high conviction
Triggers : High/Low for entry, Close for exit
Higher retests = fewer signals, higher probability.
Retest Close-Up: Zone touch + min retests (2+ for conviction).
Zones highlight on touch (more intense color) – but signals only if min retests/trigger match (aside from other filters).
█ FILTER STACK: Multi-Layer Confirmation
Momentum Filter : Catches early trend changes (aggressive = more noise)
Fast MA : Entry timing (ZLEMA on price)
Medium MA : Confirmation (EMA on MA)
Slow MA : Trend direction (T3 on close)
Patterns : Inside Bar = consolidation, Engulfing = reversal
Use OR logic for more signals, AND for quality.
█ AUTO-RR & MULTI-OBJECTIVE OPTIMIZATION
The statistics table is your virtual backtester :
RR Base : Focus on risk/reward ratio
Multi-Objective : Balances 4 metrics (RR, Win Rate, DD, PF)
Calculation Methods : Simple, Weighted, Robust Median
Suggested RR : Auto-optimized for current config
How to read it:
→ Profit Factor > 1.5 + Drawdown < 15% = robust
→ Win Rate 60% with PF 1.8 > 70% with PF 1.2
Data Window Highlights: Dynamic Params & RR
Take a look at this little animation demo showing data window with animated ellipses on key metrics (dynamic period, SL/TP)
█ STRATEGY MODES: Match Your Style
OCO Mode : One trade at a time (traditional)
Hedging : Long + Short simultaneously
Pyramid : "Only in Drawdown" = averaging down
Aggressive : "All Signals" = max opportunities
█ DUAL SIGNAL SYSTEM: Main & Table Explained
Main Signals : Crossover + retest + filters → "UP" (Green) / "DN" (Red).
Table Signals : From stats engine → "T UP" (Green) / "T DN" (Red) for high-conviction.
Some key points for Table Signals :
Trade Management : OCO, pyramiding in drawdown, or all signals — full flexibility.
Auto-RR Optimization : 4 modes to auto-tune SL/TP
Dropdown menus : Allow manual parameters or to display/apply recommended ones.
Note:
The Auto-RR system is completely independent, it doesn't take the parameters from the “statistics section” for calculations, not even as initial values, they are based solely on actual price movements (how much profit/loss an order could have made).
Remember: The stats table doesn’t just analyze — it generates real, actionable 2nd-layer signals, for hedging, swing, or custom strategies.
Dual System in Action: Signal Styles & TP/SL Fade Demo
Watch signals evolve with color/line fades, table compact modes on/off, and live TP/SL levels.
█ PRACTICAL BLUEPRINTS
A. Conservative Swing Trader
→ HMA(150), Retest 2+, Slow MA filter, OCO + First Only
→ Focus: PF > 1.5, DD < 15%
B. Active Day Trader
→ ZLEMA(20), Retest off, Momentum + Fast MA, All Signals
→ Focus: Trade frequency + Win Rate stability
C. Quant Developer
→ Use library in custom strategy:
= AdvancedMAToolkit.trend_and_signals("FRAMA", close, 50, true, 2, 200)
Zone Signals & Suggested RR
See a demo of a scrolling chart in action with highlighted zones and auto-suggested RR in table.
█ POWER COMBOS: Pro Tips for Advanced Users
SuperTrend + 3x ZLEMA : Zero-lag trend filter – responsive, low-noise for perpetuals/DAX.
Trigger as Confirmation Filter : Use 'Open' for exits – confirms at next bar opens.
Chaining MA Outputs : Pass one MA as source to another function – efficient for multi-layer setups (avoid over-chaining for speed).
█ FUTURE ROADMAP (ENHANCEMENTS IDEAS)
Custom Metric Weights: Prioritize Return % while stabilizing other metrics.
Reversal Engine: Detect via zone breaks for trend reversals.
Dynamic Position Sizing: Auto-adjust from stats table.
Multi-timeframe Integration: Use security() for higher TF confirmation.
Additional MA Types:
VIDYA — Volatility Index Dynamic MA. Smooth in choppy markets, fast in trends.
KAMA — Kaufman's Adaptive MA. Efficiency ratio-based for volatility adaptation.
ALMA — Arnaud Legoux MA. Gaussian-weighted for minimal lag + smoothness.
Planned for v3.0 – share your ideas in comments!
█ FINAL NOTE
This is a tool for thinkers . The power lies in your ability to:
Understand parameter trade-offs
Backtest across regimes
Combine with volume/order flow
Manage risk properly
Past performance ≠ future results. Use wisely.
═════════════════════════════════════════════════════════
┌──────────────────────────────────────────┐
Deep Dive: Understanding Dual Signals in AdvancedMA Toolkit
└──────────────────────────────────────────┘
The AdvancedMAToolkit is a comprehensive strategy development lab designed to empower traders with modular tools for creating, testing, and refining moving average-based systems. It goes beyond simple indicators by providing a flexible framework that adapts to real market dynamics, encouraging experimentation while emphasizing the importance of visual confirmation on the chart. Let's dive into its core philosophy and practical applications.
CORE PHILOSOPHY: Beyond Signals, Towards Understanding
This toolkit isn't a "magic indicator" that promises effortless profits—it's a strategy development lab that helps you build and iterate on systems with intention. At its heart is the understanding that trading isn't about forcing patterns but recognizing natural market behaviors. The toolkit encourages a balanced approach: use its components to construct setups, but always keep your eyes on the chart to validate results. No automation can replace human intuition in perceiving shifts in market sentiment or anomalies.
Key ways the toolkit supports this:
Build complex systems from modular MA blocks
Adapt to changing market regimes via dynamic periods, where the period can adjust based on volatility or user-defined clamping (min/max limits to prevent extreme swings).
Simulate virtual trading with real-time statistics
Optimize parameters using Auto-RR and multi-objective logic, focusing on realistic Risk/Reward based on historical price movements rather than arbitrary assumptions.
Find the best sets of options and Risk/Reward, tailored to your trading style—whether conservative hedging or aggressive swing trading.
Generate 2nd-layer high-conviction signals from main ones, where filters refine raw outputs into actionable trades without overcomplicating the core logic.
Remember, the goal is to perceive market "personality" through these tools—price scales influence zone % (e.g., 1% on crypto perpetuals might be tight or loose depending on asset volatility), and experimenting with inversions (e.g., decay/restart logic in dynamic periods) can reveal hidden patterns, like turning regression lines into zig/zag for high-limit scenarios.
CORE COMPONENTS: The Building Blocks
Start with the foundational elements that form the toolkit's backbone. The modular MA rotator allows seamless switching between 14 types, each suited to different market conditions. For instance, HMA or ZLEMA excel in trending environments, while FRAMA or SuperTrend adapt to volatility spikes. The trend_and_signals function generates raw main signals based on crossovers, retests, and filters.
The dynamic period feature is key here: it adjusts MA lengths based on market regimes, with options for exponential growth/decay or clamping to avoid overextension. Inverting decay/restart logic might seem counterintuitive at first, but it can highlight non-linear behaviors—e.g., on DAX or crypto, where price frequency doesn't always form stable patterns, this inversion turns "noise" into insight, like perceiving manipulated liquidity grabs as deviations from natural trends.
Triggers add nuance: use high/low for zone touches (entry/exit on extremes) or open/close for bar confirmation (safer in volatile perpetuals). This flexibility lets you align with asset character—e.g., on high-frequency crypto, open triggers for zones reduce false breaks, while high/low works for directional bias.
PARAMETER TUNING: Finding the Sweet Spot
Tuning is where the toolkit shines, blending manual control with automated insights. Core parameters (e.g., Factor for dynamic period, regression line lookback) interact with stats section for holistic optimization. Start with dynamic period limits: set min/max clamping to bound adaptations – a high-pass/low-pass filter that cuts fast/slow ranges for targeted regime shifts.
The Auto-RR system (4 modes) tunes SL/TP independently, based solely on price movements—not initial stats params. "Suggested" mode displays optimized values (e.g., RR 1:2 for both sides) without applying them progressively – if you insert manually, results differ because it skips bar-by-bar historical recalculation, applying them in a 'static way' at each bar (no historical evolution). In "Auto-Apply" mode, it recalculates dynamically on every bar (e.g., bar 0: 1:2, bar 1: 1.3:2.1, bar 2: 1.2:2.3), ensuring full dataset evolution matches the display.
Experiment with high general periods (e.g., 5000+ lookback): regression lines turn into zig/zag ("clipped waves" like audio peaks beyond scale) – not errors, but insights into deviations or manipulations. Always cross-check with eyes on the chart: tweak % zones for asset scale (e.g., 1% tight on crypto perpetuals, loose on indices) if they feel mismatched (too expanded/contracted) – no auto-scaling yet (future idea?), but visual feedback guides adjustments. Switch MA types (e.g., VWMA for volume-weighted insights) if needed, at the end of the journey, the circle starts at MA and after gradual test of parameters combinations it turns back to MA, that in these cases remain the last tweak when all the rest is properly settled.
FILTERS & COMBINATIONS: Layering for Precision
Filters are the toolkit's secret weapon for refining signals without overwhelming the system. The fast filter (price-based) pairs well with momentum for quick momentum plays, while medium holds up in combos with fast + momentum. Slow adds stability but can over-filter if not lightened.
Key combos to test:
Fast + Momentum: Lightweight, ideal for high-frequency assets like crypto perpetuals – use for initial signal pruning.
Fast + Momentum + Patterns: Holds in volatile markets; patterns add robustness without excess lag.
All Filters (Fast + Medium + Slow + Patterns): Reduces signals drastically – use sparingly, as ❝too much is less❞ (over-filtering). On DAX, medium + slow might outperform full stack; on crypto, fast + momentum often suffices.
Standalone Patterns: Surprisingly effective alone for visual confirmation – experiment by disabling others.
Associate with dynamic period: lighter filters (fast/momentum) pair with aggressive dynamic settings; heavier (medium/slow) with clamped periods. The goal? Balance: too many filters choke opportunities, but strategic combos (e.g., fast + slow without medium) can surprise. Always monitor core signals as "raw" baseline – filters refine, but don't replace chart intuition.
Pro Tip for Power Users: SuperTrend is the star here (ATR-based levels for dynamic support/resistance). Pair it with ZLEMA in all 3 filters for low-lag setups – e.g., SuperTrend + 3x ZLEMA creates a "zero-lag trend filter" that's responsive without noise, perfect for perpetuals or DAX. Triggers enhance this: use 'Open' for exits to confirm if the next bar opens in the signal zone, acting as a built-in validation filter.
ADVANCED EXPERIMENTATION: Unlocking Hidden Dynamics
Push the toolkit further with targeted tweaks. Invert dynamic period decay/restart for non-standard insights: on high lookback, regression becomes zig/zag – intentional "volume up" to spot peaks/outliers, revealing liquidity grabs or manipulations as deviations from natural patterns.
Scale awareness is crucial: % zones vary by asset (1% tight on crypto, loose on indices like DAX) – no auto-scaling yet, but manual adjustment + chart eyes spot mismatches (zones too stretched/contracted = tweak % or MA type). Frequency/TF influence: high-frequency perpetuals favor fast triggers (open for zones), while lower TF need high/low for extremes.
Combine with volumetrics (future integration): use gravity centers from higher TF as retest zones – if prices bounce/break, it's a signal. Add volatility auto-correlations for "perceiving" present moves (vol real = money), vs technical as "past photo". This hybrid turns the toolkit into a full strategy lab.
For Quantum Developers: Chain MA outputs as source to another function call – e.g., use one MA result as input for a second trend_and_signals(). It's efficient (no major speed hit), but avoid over-chaining to keep performance crisp.
Experimentation Fade: Zig/Zag & Variant Entries
See a fade through preset changes, regression zig/zag, and entry variations on same chart.
INTEGRATION WITH REAL-TIME ANALYSIS: The Volumetric Bridge
While the toolkit excels in technical "past photos" (patterns, trends), pair it with volumetrics/order-flow for "present" edge. Find volumetric gravity centers on higher TF – use as additional retest: bounce = confirmation, break = reversal. Auto-correlate volatility to gauge market character – smooth for chop, fast for trends.
This synergy: toolkit for setup/optimization, volumetrics for execution. No gaps in order-flow = precise entries; toolkit's stats refine MM (OCO for hedging, pyramiding in drawdown for recovery). Result: perceive manipulations (liquidity grabs as "unnatural" deviations) and trade with conviction.
CONCLUSION: Empower Your Trading
The AdvancedMAToolkit is your lab for crafting strategies – experiment freely, but always verify on the chart. From core MA to filtered signals, it's designed for flexibility without forcing trades. Future volumetric integration will elevate it further. Share your setups in comments!
(For the Auto-RR: 4 modes tune SL/TP based on price alone – independent, forward-looking. Test on perpetuals for scale insights.)
══════════════════════════════════════════════════════════
🛡️ Essential Disclaimer & Final Note
This is a sophisticated analytical tool for education, research, and strategy development. The statistics are based on historical data and virtual trading. Past performance is not indicative of future results.
You must do the following:
Understand the logic behind every setting you change.
Thoroughly backtest across different market conditions (trending, ranging, volatile).
Practice sound risk management, including appropriate position sizing, before ever considering live trading.
The power of this tool is directly proportional to the understanding and discipline of the user. It is designed not to give you easy answers, but to help you ask better questions and find robust, personalized trading solutions.

Ripple Market Warning! Strong Bearish Setup Emerging🚨 XRP/USDT BEARISH REVERSAL SETUP 🎯 | Swing Trade Blueprint
Asset: XRP/USDT (Ripple vs Tether) 💎
Market: Cryptocurrency
Strategy: Swing Trade - BEARISH 🐻📉
📊 TRADE SETUP
🔴 BIAS: Bearish Momentum Building
📍 ENTRY: Flexible Entry - Any Current Price Level ($2.26 area)
⚠️ RISK MANAGEMENT (CRITICAL)
🛑 Stop Loss Reference: $2.7000
⚡ IMPORTANT: This is a reference SL only. Adjust based on YOUR strategy & risk tolerance.
✅ PRO TIP: Place SL AFTER breakout confirmation. DO NOT set it prematurely!
🎯 Dear Traders & OG's: I'm NOT recommending you blindly follow my SL. This is YOUR trade, YOUR capital, YOUR risk. Manage it accordingly!
🎯 PROFIT TARGET
🔥 PRIMARY TARGET: $1.6000
📌 Technical Support:
Triangular Moving Average acting as strong support zone
Oversold conditions developing
Liquidity trap zone - TAKE PROFITS strategically
💰 Risk Disclaimer: I'm NOT recommending you follow only my TP. Scale out, take profits at YOUR comfort levels. Secure the bag at YOUR own discretion!
🔗 CORRELATED PAIRS TO WATCH
Direct XRP Pairs:
XRP/USD 💵 - Monitor for divergence signals
XRP/BTC ₿ - Bitcoin pair correlation strength
XRP/ETH Ξ - Ethereum cross-pair dynamics
Related Market Movers:
BTC/USDT - Bitcoin dominance impacts alt direction
ETH/USDT - Ethereum weakness = altcoin pressure
SOL/USDT - High-cap alt comparison
ADA/USDT - Similar smart contract platform competitor
🧠 KEY TECHNICAL FACTORS
✅ Descending channel formation
✅ Triangular MA support confluence
✅ Oversold RSI conditions approaching
✅ Volume divergence patterns
✅ Liquidity zones below current price
🔗 Market Correlation Logic:
When BTC/USDT shows weakness, XRP typically follows with amplified moves. Monitor Bitcoin for confirmation of bearish continuation. If Bitcoin stabilizes above key support, XRP may find temporary relief before next leg down.
⚡ ACTION PLAN
1️⃣ ENTRY: Scale in at current levels
2️⃣ CONFIRMATION: Wait for breakout validation
3️⃣ STOP PLACEMENT: Set SL after confirmation (suggest above $2.70)
4️⃣ PROFIT MANAGEMENT: Scale out profits toward $1.60 target
5️⃣ MONITORING: Watch BTC dominance & overall crypto market sentiment
🔔 Follow for more setups | 👍 Like if this helps | 💬 Comment your thoughts!
📊 Stay disciplined. Trade smart. Protect capital.
#XRPUSDT #CryptoTrading #SwingTrade #BearishSetup #RippleTrade #CryptoAnalysis #TradingView #AltcoinTrading


XRP Update📊 XRP Update
XRP is approaching the green support zone 🟢
Now the question is — will it bounce or break below? ⚖️
If it holds, we could see a strong rebound 📈
But if it breaks, expect a deeper correction 🔻

XRP elliot wave scenario: 5 wave upside?For my full xrp elliot wave scenario, check my earlier post where I cover the elliot wave count on the weekly timeframe for my long term setup based on probabilities.
Zooming in on the 4H timeframe, we have seen a beautiful momentum to the upside but for now it's still a three wave move. We need five waves to the upside to confirm a bullish setup by finishing a wave I to create opportunities for the wave II.
Currently we are in the wave three and the target is the 1.618 fib sitting at 2.62$.
The invalidation of this setup and a five wave impulse is the 0.618 fib of the internal wave four of wave three sitting at 2.31$ as this would invalidate the internal wave four of the wave three.
to make it easy:
bullish scenario:
wave 3 target: 2.62
After that a wave 4 and wave 5 to finish the wave I
Then we have finished a wave I and can prepare the setup for a wave II
bearish scenario:
we make only 3 waves with invalidation sitting at 2.31 which is the 0.618 of the internal wave 4 of wave 3
Share your opinion! Peace!

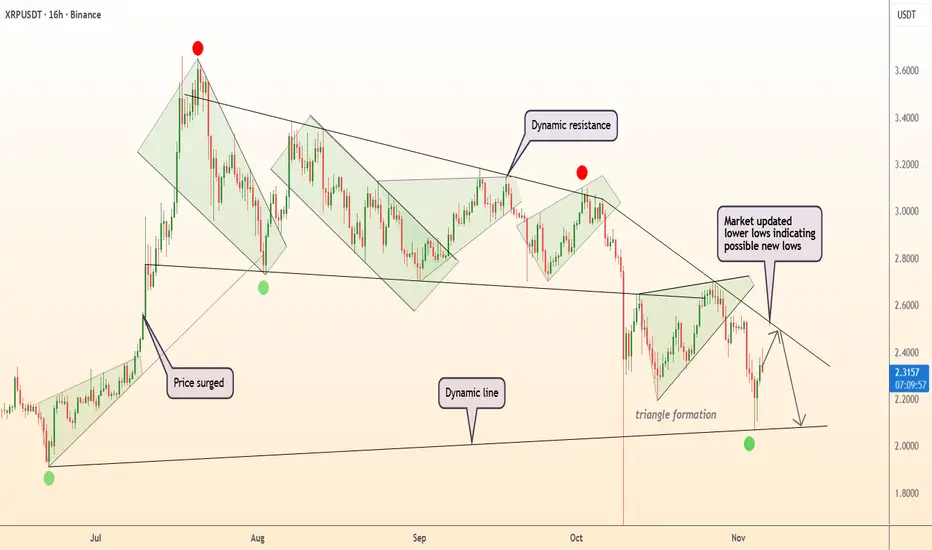
Lingrid | XRPUSDT Downside Pressure AcceleratingBINANCE:XRPUSDT trades below the descending trendline inside a clearly defined downward channel, keeping the broader structure bearish. Price action has recently tested the $2.44 zone but failed to sustain a breakout, signaling continued weakness. As long as the pair stays under $2.50 resistance, a retest toward $2.00 support remains the likely path. Momentum indicators align with a slow drift lower, reinforcing short-term bearish control.
⚠️ Risks:
A sudden Bitcoin rally could lift altcoins and negate the bearish setup.
Positive regulatory news around XRP may trigger unexpected volatility.
U.S. macro data or risk sentiment shifts could strengthen USD demand dynamics.
If this idea resonates with you or you have your own opinion, traders, hit the comments. I’m excited to read your thoughts!

XRP Price Is 9% From Crashing To $2, Can It Be Avoided?At the time of writing, XRP is priced at $2.21, trading below the key resistance at $2.27. If long-term holders begin selling aggressively, the altcoin could fall toward $2.00, marking a 9% decline from current levels.
A drop to $2.00 would require XRP to break through supports at $2.13 and $2.02, both critical levels for short-term stability. If these fail to hold, the altcoin could experience accelerated losses.
However, if investor sentiment strengthens, XRP could rebound above $2.27 and aim for $2.35. A decisive break beyond $2.54 would confirm recovery and invalidate the current bearish outlook, signaling renewed bullish control.
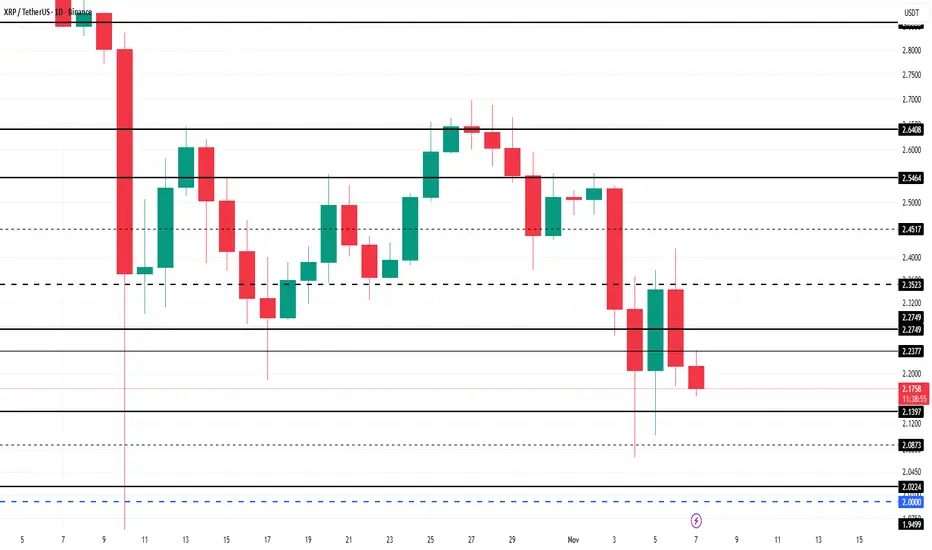

DeGRAM | XRPUSD keeps a descending structure📊 Technical Analysis
● XRP/USD remains below the dynamic resistance line, forming a series of lower highs and lower lows that reinforce the bearish structure. The recent rejection from $2.60 and continuation within the descending pattern point to possible retests of lower supports.
● A breakdown below the $2.20–$2.00 zone could accelerate selling pressure, confirming a move toward new lows within the broader downtrend channel.
💡 Fundamental Analysis
● Recent market uncertainty and reduced risk appetite among crypto investors continue to weigh on altcoins, with XRP showing weaker recovery compared to peers.
✨ Summary
● Key resistance: $2.60. Support: $2.00. A sustained move below $2.20 could extend the decline toward $1.90.
-------------------
Share your opinion in the comments and support the idea with a like. Thanks for your support!
XRPUSDT.P - November 6, 2025XRPUSDT.P is showing a short-term bullish recovery, holding above the ascending trendline after rebounding from the $2.2266–$2.0655 support zone. Price is currently testing near $2.2745, with upside potential toward the $2.3126 partial profit level and $2.3640 profit target.
A clean break above $2.3126 would confirm continuation toward higher resistance, while a drop below $2.2266 would invalidate the setup and suggest renewed bearish pressure.
Risk Assessment: Moderate — momentum is improving with trendline support intact, but confirmation above $2.3126 is needed to sustain the bullish move.

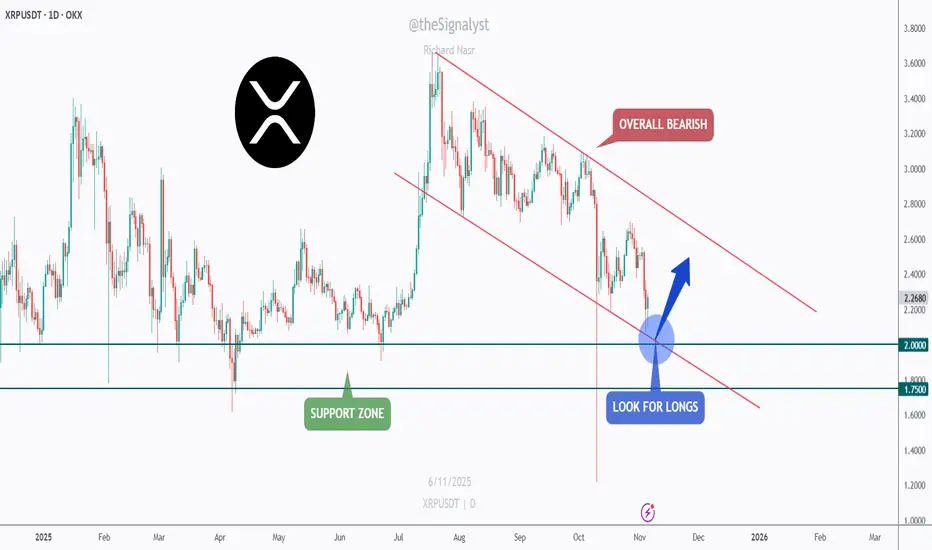
XRP - Watching the Confluence Zone for a Bullish Rebound!📉XRP has been in a clear bearish channel for months , forming consistent lower highs and lower lows.
However, the current structure is approaching a critical confluence zone, where the lower bound of the red channel meets the major green support area between $1.75 and $2.00.
⚔️As long as this intersection holds, I’ll be looking for potential long opportunities, anticipating a short-term bullish correction toward the upper boundary of the channel.
This setup offers a clean risk-to-reward opportunity if the bulls manage to defend the zone and regain momentum.
If the support gives way, further downside could follow, but for now, this area remains a key decision point for XRP’s next move.
⚠️ Disclaimer: This is not financial advice. Always do your own research and manage risk properly.
📊All Strategies Are Good; If Managed Properly!
~Richard Nasr
XRP elliot wave analysis: ending the wave IISee my first post for the xrp elliot wave count on the weekly timeframe
We finished a wave I last year towards 3.40
Then we started a wave II and topped it at 3.65 as an expanded ABC flat.
The wave C (in 5 waves as of elliot wave count) should now be in its last leg to the downside and this can be the most brutal.
I do not recognize this wick of wave 3 so deep because of huge manipulation that day so I stick to the low of coinbase which was at 1.78$
Interesting: I put this parallel channel a while ago and even though we have seen crazy dips, it closes above or at the edge of the channel. Preferably we get out of this channel and make some closing candles below it in a 5th wave to the downside.
After that we can look for a strong push in a wave III towards the 5$ region.
This is my most probable scenario as of now but things can change quickly as we get more information. I'll keep everything updated
Other scenarios?
see my posts.
Share your opinion! Peace!

XRP/USDT: Bearish Channel Holds as Price Struggles Below $2.50XRP/USDT continues to trade below the descending trendline inside a clear downward channel, maintaining a bearish structure. The recent rejection at the $2.44 zone signals ongoing weakness, with price unable to break higher.
As long as it stays below the $2.50 resistance, a move back toward $2.00 support remains likely. Momentum favors a gradual drift lower, keeping short-term bearish pressure in place.
⚠️ Risks:
– A Bitcoin rally could lift altcoins and disrupt the setup.
– Regulatory news around XRP may increase volatility.
– U.S. macro shifts could impact USD strength and XRP flow.

XRPUSDT.P - November 4, 2025XRPUSDT.P is maintaining a mixed-to-bearish market structure on the 15-minute timeframe, with price currently trading around the $2.3069 region after a corrective bounce. The pair continues to respect a sequence of lower highs and lower lows, suggesting that bearish momentum remains intact.
A potential short-term rally toward the $2.3347 resistance zone could occur before sellers reassert control. A rejection from this level may trigger a downside continuation toward the $2.1995 support target, aligning with the broader bearish projection shown.
However, a sustained breakout above the $2.3347 resistance and the invalidation level near $2.37 would negate this bearish scenario and signal a possible short-term bullish reversal.

XRP Profits at 12-Month Low, But New Investors Eye Price RevivalAt the time of writing, XRP trades at $2.26, down 10% over the past 24 hours. The altcoin continues to face resistance amid broader bearish market sentiment. However, strong support remains near the $2.27 mark, offering hope for a potential recovery.
If XRP maintains this key support level, it may move sideways in the short term, with possible rebounds to $2.35 or $2.45 as buyers regain confidence. This consolidation could set the stage for a stronger move upward later in November.
However, if selling pressure intensifies, XRP could fall below $2.27, slipping through $2.23 and hitting $2.13. Such a drop would invalidate the bullish scenario and confirm a deeper corrective phase.

xrp elliot wave probability (update)The current large dip is giving us more clarity.
My primary scenario is still the same:
We finished a wave I and are finishing a wave II now on the weekly timeframe.
The wave C of wave II has to move in 5 waves to the downside. After the crash of october 10th it has only been 3 waves and ending with such a wick never satisfies me as price needs to form a range at the bottom before moving back to the upside.
So we still expect another wave 5 to the downside that could be happening right now. The thing is that the wave 3 was a huge manipulation wick because of the tariff drama which makes it very unlikely and not even preferable for a wave 5 to take out that low as it would be larger than the wave 3. This is why consideration is that wave 5 is a truncation where it can't take out the low of wave 3.
Other bullish scenario?
I would count the the wave I as wave I, II and III and we are now in an expanded flat in a wave IV. The reason why this is not the primary scenario is because of the crash of october 10th that took out the 0.618 fib of wave 3. But this is on the XRPUSDT chart. If we take the XRPUSD chart of coinbase, the bottom was at 1.78 and we never hit the 0.618 fib. In that case this elliot wave count is still valid and in this case the wave 5 to the downside HAS to take out the wave 3 BUT the 0.618 fib sits at 1.58. The wave needs to stay above that to not invalidate a wave IV. in any case, both scenarios whether its a wave II or a wave IV still target the 5$ region at least.
Bearish scenario?
I can also count 5 waves on the weekly timeframe and with that the cycle has ended and we have started an ABC to the downside with price levels targeting as low as 0.70$. The reason why this has the least probability right now is because the wave V in this scenario doesnt have 5 waves (april low till july all time high). I can only see 3 waves to the upside which means it was only corrective (like an expanded B wave for example)
A lot of reading but being prepared for everything is key to win this game!
Share your opinion! Peace!

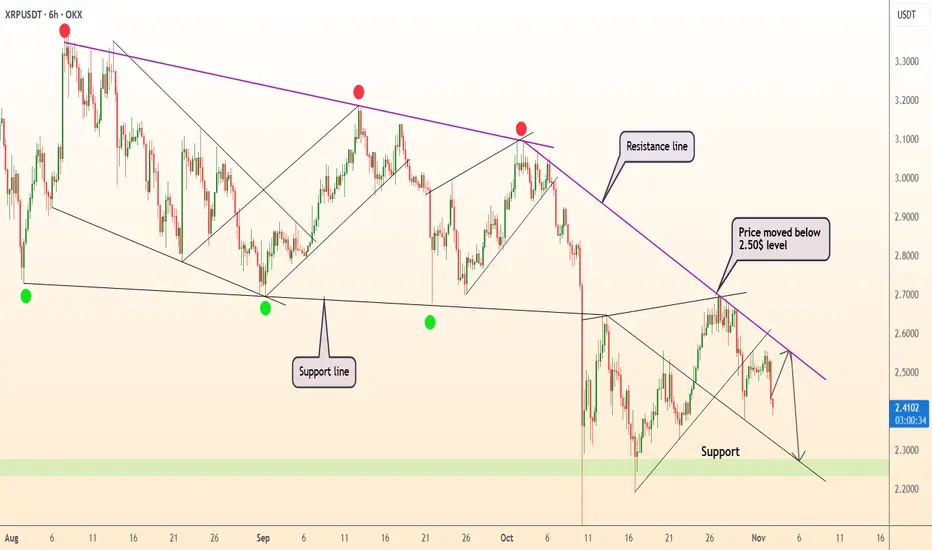
DeGRAM | XRPUSD moved below the $2.5 level📊 Technical Analysis
● XRP/USD continues to move within a descending structure, consistently rejecting from the resistance line near $2.50. The price broke below this level, confirming renewed selling momentum.
● With repeated failures to hold higher lows, the pair targets the next support zone around $2.30–$2.25, aligning with the broader bearish channel formation.
💡 Fundamental Analysis
● Ripple’s price remains under pressure as market liquidity tightens and investor appetite for altcoins declines amid rising U.S. yields.
✨ Summary
● Short bias below $2.50; targets $2.30–$2.25. Technical rejection and weaker sentiment reinforce bearish continuation.
-------------------
Share your opinion in the comments and support the idea with a like. Thanks for your support!