XRPUSDTThis appears to be a favorable buying opportunity, as the asset has established a well-defined support level. The stability demonstrated at this zone reduces downside risk and provides a solid foundation for potential upward movement.
XRPUSDT.P trade ideas

Revenge Trading – The Loop That Drains YouNOTE: This is a post on Mindset and emotion. It is NOT a Trade idea or strategy designed to make you money. If anything, I’m posting this to help you preserve your capital, energy and will so you can execute your own trading system with calm, patience and confidence. I’ll keep it short here. If this resonates, please follow my newsletter for deeper dives into mindset.
Momentum and trend are in play and you’re lining up for the next opportunity to join the trend up.
Diligently - you follow your rules and get in when the ‘stars align’ and when the indicators you’ve chosen give you the confirmation you’re looking for to get in.
And then you’re stopped out.
“I’ll get it back on the next one.” . It starts as a whisper in your head right after a loss.
"Is it a false breakout? Is it noise? "
You don’t even consider ‘chop’ right now.
You re-enter
Stopped again and again.
This is starting to feel personal.
What’s really happening inside you:
Thoughts: “The market took from me.” “I’ll show it.”
Feelings: Anger, injustice, shame.
Behaviours: Increasing size, doubling down, moving stops.
Body cues: Racing heart, clenched jaw, tunnel vision.
Trigger: A loss that feels unfair or personal.
This is anger disguised as trading. You have been triggered.
How to take control of this:
Name it: Say out loud “I’m acting out here.” Ask yourself - ‘Do I really want to do this, is this part of the plan or am I honestly revenge trading?’. Asking these questions at least stops the automatic reaction of just jumping in and brings awareness to the situation. It’s a breaker switch that interrupts the loop.
Ground yourself: notice your breath, your heart, your body. It’s likely that your biology is reacting to the loss which means hormones such as [adrenaline and cortisol are racing through you. Step away until the adrenaline settles.
Reframe the loss: remind yourself: The win I’m chasing won’t undo the loss. Only discipline will. Losses in this game are a cost of doing business. I accept that there are costs and I am in control of my spend as any successful business owner does.
Losing isn’t the problem. How you react to the loss defines your career.
If you found this useful, also have a look at a previous post I’ve put up on revenge trading. Here’s the link.
I also offered some reflections on a trade post sent to me by another TradingView user. The topic wasn’t revenge, but the challenge presented by the market wasn't too dissimilar.

Forecast for XRPUSDT 30th September 2026 (Updated)Macro forecasting XRP to ~$2.9 followed by a short sell to ~$2.5 then a large move to ~$3.1 then a huge move to the downside to ~$2.25-$2.3 then to the heavens for Q4


XRPUSDT 1D falling wedge coiling for breakoutPrice is compressing inside a falling wedge with demand below 2.72. A clean daily close above 2.98 opens 3.05 then 3.15.
Trend is corrective after the July impulse, printing lower highs inside a falling wedge. Internal structure is bearish-to-neutral, but compression suggests energy building for a break. Price sits mid range near the 0.5 retracement, with external liquidity resting above 3.05 to 3.15 and equal lows below 2.55 to 2.47. A daily break and hold above the wedge top would mark a change of character back to bullish; a sweep into the lower green box keeps the larger uptrend corrective.
Levels
Wedge resistance: 2.98
FVG supply ceiling: 3.15
0.5 retracement: 2.905
0.618 retracement: 2.726
Liquidity below swing lows: 2.470
Plan A
Trigger and confirmation
Wait for a daily close above 2.98 and the wedge trendline. Look for a retest that holds as a bullish order block or a higher low on 4H.
Invalidation level
A daily close back inside the wedge or below 2.86.
Targets: TP1, TP2, runner
TP1 3.05, TP2 3.15, runner 3.35 toward prior range high.
What would invalidate the idea
Failure to hold the breakout retest and sustained acceptance back under 2.90.
Plan B
If price sweeps the downside first, watch 2.72 to 2.60. Trigger on a sweep and reclaim of 2.70 with a 4H change of character.
Invalidation and targets
Invalidation on a daily close below 2.47. Targets 2.90, 3.05, 3.15.
Confluence
EMAs 20 and 50 are flattening while the 200 remains upsloping, consistent with a corrective pause. RSI is holding near 50 with mild bullish divergence versus the September swing low. Volume has compressed during the wedge, so expansion after a break should confirm. Volume profile favors 2.90 as a local point of control, with value area low near 2.70 aligning with the 0.618. Fib context places current price near the 50 level, with discount bids in the 62 to 79 zone.
Risk
Define risk at invalidation, not by feel. Size positions so a full stop hit is tolerable. Wait for confirmation instead of chasing the first spike.
Disclaimer
Educational content only and not financial advice
Forecast for XRPUSDT 30th September 2026 For the next week forecasting XRP to ~$2.9 followed by a short sell to ~$2.7 then a large move to ~$3.1 then a huge move to the downside.

EUR USD AUD NVDA MSFT AVGO S&P500 BTC XRP Weekly InsightsIn this video, we dive into the key market movements and outlooks for major financial instruments over the past week. Highlights include:
Analysis of currency pairs: EUR/USD and AUD
Trends and technical setups for leading tech stocks: NVDA, MSFT, AAPL, AVGO
The S&P 500’s performance and what it suggests about broader market direction
Developments in cryptocurrency, with a focus on BTC and XRP
Whether you’re a trader, investor, or just interested in macro markets, this video gives you a consolidated, data-driven snapshot of where things stand and what to watch next.

XRP USDT Hello my friend, Ripple is currently in a triangle and is currently in a very good support area, especially since it has now reached a very good pivot at 2.7. I predict that Ripple will reach a buy price of 4.4. Thank you for reading my analysis and giving your opinion.

XRP ETF Approved, But Price Hurts—Will Big Players Act?At the time of writing, XRP trades at $2.84, just under the $2.85 resistance. A flip of this barrier into support would likely signal the beginning of a reversal, strengthening bullish sentiment. Traders are closely watching this zone for confirmation.
If support from LTHs holds, XRP could climb toward $2.94 in the short term. Breaching this level would pave the way for a further rise to $3.02, signaling broader recovery potential and invalidating near-term bearish concerns.
However, if market conditions worsen or LTHs shift their strategy to selling, XRP could lose momentum. The altcoin risks sliding toward $2.75 or even deeper to $2.64, putting bullish expectations in jeopardy and prolonging the consolidation phase.

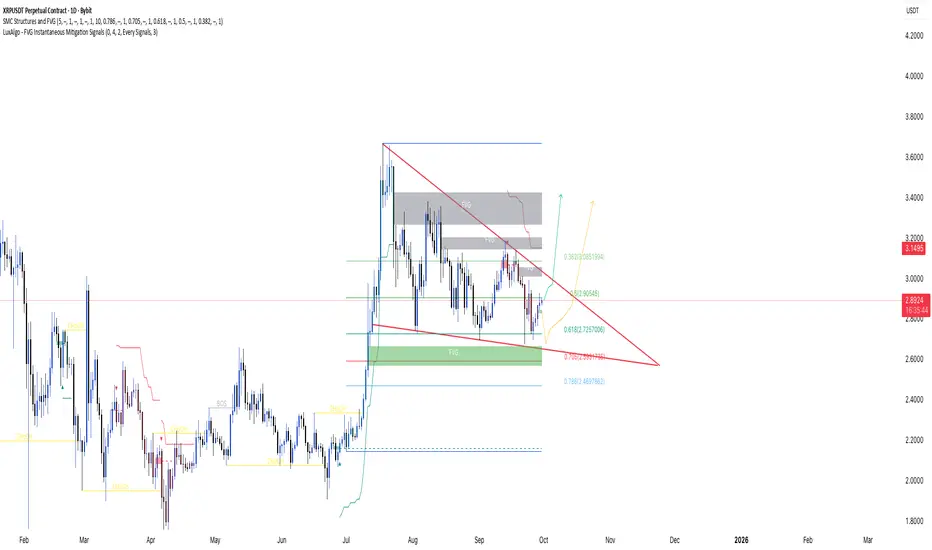
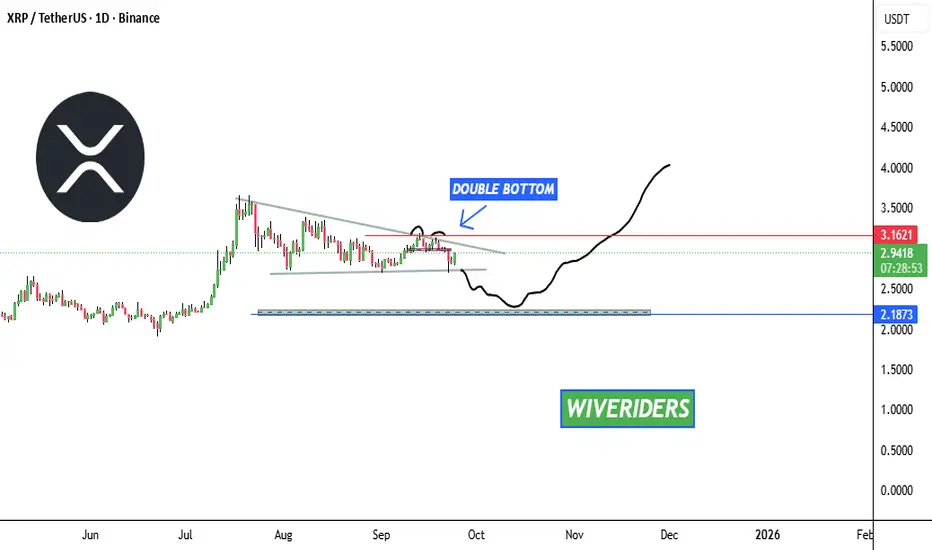
XRP Daily Market Update📊 CRYPTOCAP:XRP Daily Market Update
CRYPTOCAP:XRP is forming bullish patterns overall ✅ but here’s what’s next:
1️⃣ Around $3.1621 there is a Double Top bearish pattern. XRP needs to break this level with confirmation to indicate the trend remains bullish.
2️⃣ Another option ⚠️ — XRP could cross down, grab liquidity, hunt stop-losses, and reach the green support zone around $2.1873. From there, buyers may step in again since strong accumulation and volume exchanged at this level.
🔎 On the higher time frame, XRP is still bullish 📈 — but this is the daily scenario at the moment.
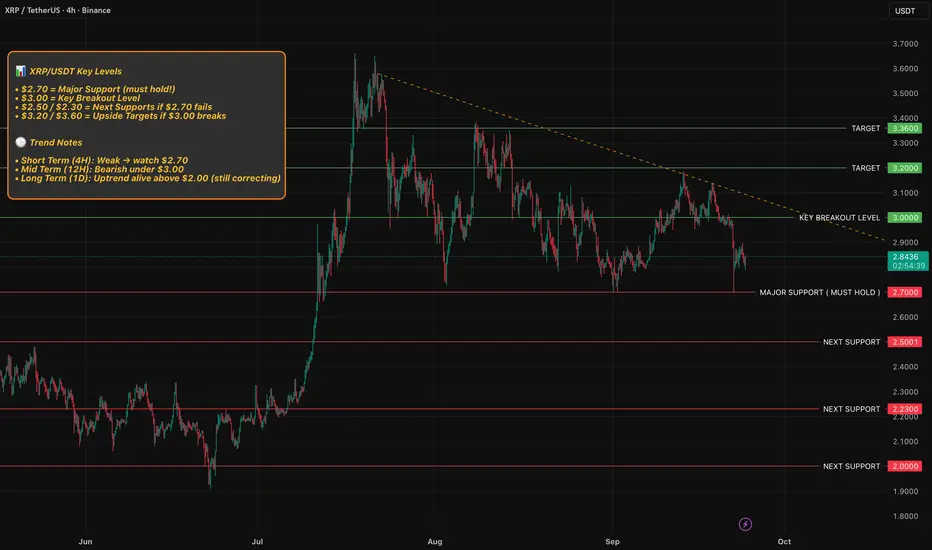
XRP is at a MAJOR decision point !
📊 XRP/USDT Key Levels
• $2.70 = Major Support (must hold!)
• $3.00 = Key Breakout Level
• $2.50 / $2.30 = Next Supports if $2.70 fails
• $3.20 / $3.60 = Upside Targets if $3.00 breaks
🕒 Trend Notes
• Short Term (4H): Weak → watch $2.70
• Mid Term (12H): Bearish under $3.00
• Long Term (1D): Uptrend alive above $2.00 (still correcting)
Thank you for reading my idea, let me know your thoughts and please support by leaving a simple comment as this helps me stay motivated and keep going.
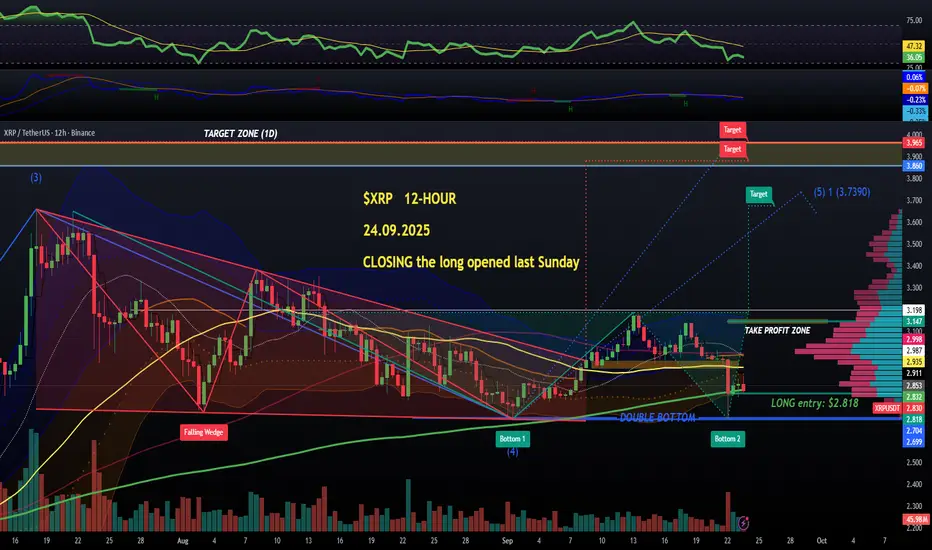
$XRP... closing my LONG position opened last Sunday &2.818CRYPTOCAP:XRP is losing 200 MA on the 12-HOUR chart so I'm closing my Sunday long position (opened here at $2.818. No loss, but this is just bearish at the moment.
Still might recover but I have closed the position mainly due to BULLISH CRYPTOCAP:BTC dominance charts.
I do not go against the trend, and the trend is negative for alts this week. I will try and catch a potential flash-crash based on smaller timeframes, stay tuned, the 4-HOUR chart incoming👽💙
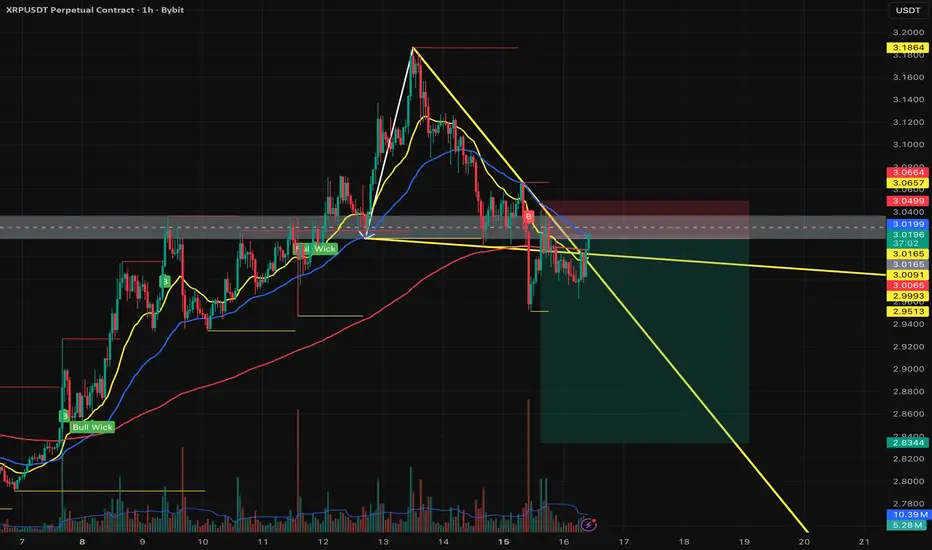
XRP at Crossroads: Will $3.22 Break or $2.71 Collapse?XRP is trading just above the descending trendline that’s been active since mid-July, showing signs of compression and potential breakout.
Price is hovering between key resistance at $3.0166–$3.2164 and support at $2.7149–$2.7857, forming a tight consolidation range.
Bullish breakout above $3.17 could trigger a rally toward $3.37–$3.64, especially if ETF filings gain traction.
Bearish breakdown below $2.71 may lead to a drop toward $2.50–$2.26, as suggested by recent institutional liquidations and technical pressure.

Another Triangle on the Radar - XRP - are we going down?Alright traders 👋, here’s another triangle setup I’m watching. Hopefully this one breaks the right way and gives us a nice move!
💤 The crypto market could really use a little cooldown period – and this trade might just fit into that scenario.
As always, let’s see how it plays out. Trade safe & good luck! 🍀
XRP Daily Chart – Bullish Breakout & Trade PlanTrend Structure: Price has broken above a long-term descending resistance line and is now retesting it as support.
Dynamic Support: Holding above the 50-day moving average, which is acting as a launchpad.
Pattern: Cup and handle formation visible — a bullish continuation setup, pending breakout confirmation.
Momentum:
RSI is holding above 50, indicating positive momentum.
MACD is above the signal line with a green histogram, suggesting bullish pressure.
Volume: Currently average — a breakout with higher volume would add conviction.
Catalyst: Potential ETF-related news could accelerate price action in either direction.
Support Strength: Strong base; would require significant selling pressure to break.
🎯 Trade Plan
Bias: Bullish, but awaiting breakout confirmation.
Entry Trigger
Aggressive: Enter on current support hold above 50 MA with tight stop.
Conservative: Wait for a daily close above the handle’s resistance (~$3.17–$3.18) with increased volume.
Targets
First Target: $3.17–$3.18 (handle breakout zone)
Second Target: $3.34 (measured move from cup and handle)
Stop-Loss
Below $2.79 (beneath retest zone and 50 MA) to protect against false breakouts.
Risk Management
Risk 1–2% of capital per trade.
Adjust stop to breakeven once first target is hit.
Notes
Watch for volume confirmation on breakout.
Be mindful of ETF news timing — could cause volatility spikes.
If price fails to hold the 50 MA, reassess bullish bias.

XRP/USDT – Technical & Fundamental AnalysisXRP/USDT – Technical & Fundamental Analysis
Fundamentals:
Ripple is gaining momentum as the SEC case eases, partnerships in Asia expand, and new XRPL upgrades support tokenization and smart contracts. Institutional interest is growing, which could strengthen XRP’s position further. However, regulatory changes and overall crypto market volatility remain key risks to monitor.
Technicals:
XRP previously formed a series of lower highs (LH) until reaching the major support zone at 2.6800, completing a descending triangle. After breaking the trendline, a change of character was observed around the 3.0000 level, signaling potential bullish reversal.
Price action suggests waiting for a liquidity hunt below the zone before anticipating another breakout to the upside.
Trade Setup (4H Chart):
Entry (Buy Stop): 3.0540
Stop Loss (SL): 2.8830 (below liquidity zone)
Take Profit 1 (TP1): 3.4000 → Risk:Reward ≈ 1:2
Take Profit 2 (TP2): 3.6530 → Risk:Reward ≈ 1:3
Outlook:
The setup favors a bullish continuation if price confirms the liquidity grab and reclaims higher levels. Traders should remain patient for confirmation before scaling positions.
📌 Disclaimer: This is not financial advice. Always wait for confirmation before entering trades. Manage your risk and trade with discipline.

XRP AGAIN!!!Hello friends
As you can see, the price had a price action gap that has now come and filled this gap and this area has become a strong support that if this area is maintained, we will go for higher targets and if the price falls further in the two support areas, we can buy in steps with capital and risk management.
*Trade safely with us*

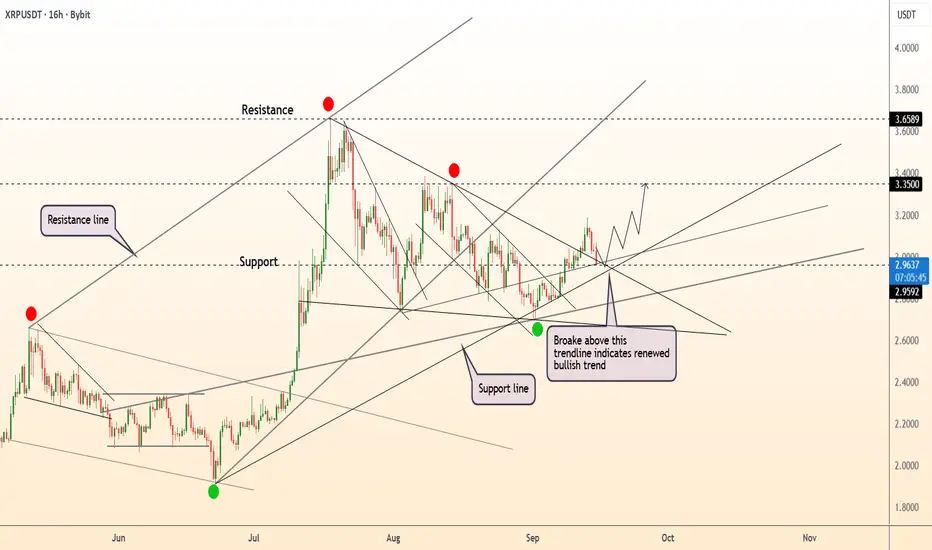
DeGRAM | XRPUSD is testing the support📊 Technical Analysis
● XRP/USD broke above the descending trendline, signaling renewed bullish structure and confirming support near 2.95.
● Price is coiling for continuation, with upside targets at 3.35 and potentially 3.65 if momentum extends.
💡 Fundamental Analysis
● Optimism for altcoins is supported by improved market liquidity and steady institutional inflows, while XRP’s active participation in cross-border payments continues to bolster adoption outlook.
✨ Summary
Bullish above 2.95; targets 3.35 → 3.65. Invalidation on a close below 2.95.
-------------------
Share your opinion in the comments and support the idea with a like. Thanks for your support!
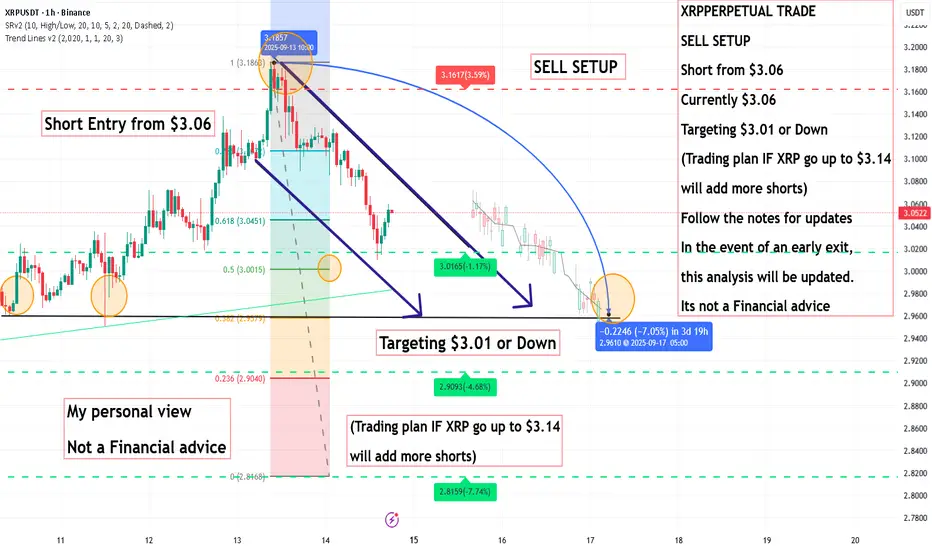
XRP PERPETUAL TRADE SELL SETUP Short from $3.06XRP PERPETUAL TRADE
SELL SETUP
Short from $3.06
Currently $3.06
Targeting $3.01 or Down
(Trading plan IF XRP go up to $3.14
will add more shorts)
Follow the notes for updates
In the event of an early exit,
this analysis will be updated.
Its not a Financial advice
DeGRAM | XRPUSD reached the support📊 Technical Analysis
● XRP/USD is stabilizing above 2.72 support, showing reversal signs with higher lows forming near the channel base.
● A breakout over 3.00–3.20 would confirm renewed bullish momentum, opening the way toward 3.53 resistance and potentially higher.
💡 Fundamental Analysis
● Positive sentiment is reinforced by growing institutional flows into altcoins, with XRP seeing increased derivatives activity and improved liquidity on major exchanges.
✨ Summary
Bullish above 2.72; targets 3.20 → 3.53. Invalidation on a close below 2.72.
-------------------
Share your opinion in the comments and support the idea with a like. Thanks for your support!

ANALYSIS FOR XRP/USDT Recently XRP have been in a pullback after an uptrend, the pullback happened so fast but now it seems to have slowed down. The price seems to have a small halt to the down trend, though to the lowest swing low of the whole uptrend move to the highest swing high drawing a Fibonacci retracement, the price is yet to hit the 50% or the 61% levels which are considered best levels of Fibonacci. We might see a reversal from here and by doing that the XRP will be on track to the moon. let's wait and see, still i remain bullish about the price of XRP. At the second lowest swing low of the uptrend if you draw a Fibonacci retracement the price is in a perfect golden zone of 61%

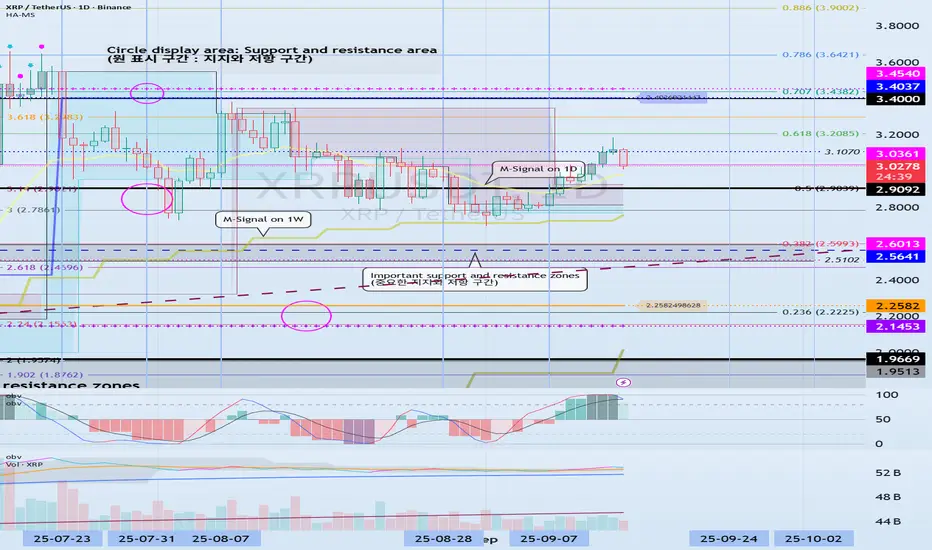
Check for support around 3.0361
Hello, fellow traders!
If you "Follow" me, you'll always get the latest information quickly. Have a great day today.
-------------------------------------
(XRPUSDT 1D chart)
The next volatility period is around September 24th.
However, we should closely monitor the movements around September 18th, which is also the volatile period for BTC.
The key is whether it can find support near 3.0361 and rise above 3.4037.
If not, we should check for support near 2.9092.
The 3.0361 level is the DOM (60) indicator point on the 1M chart. If it finds support near this level and rises, it could potentially lead to a long-term, step-like uptrend.
However, since the HA-High ~ DOM (60) range on the 1D chart is currently formed in the 3.4037-3.4540 range, a breakout above this range is expected to initiate a stepwise uptrend.
-
Thank you for reading to the end.
I wish you successful trading.
--------------------------------------------------
- Here's an explanation of the big picture.
(3-year bull market, 1-year bear market pattern)
I will provide more details when the bear market begins.
------------------------------------------------------
XRP Game PlanXRP Game Plan
📊 Market Sentiment
Overall sentiment remains bullish, supported by expectations of a 0.25% rate cut in the upcoming FOMC meeting. A weakening USD and increasing global risk appetite are creating favorable conditions for further upside in crypto assets.
📈 Technical Analysis
Price rejected the bearish trendline and started moving lower.
This indicates to me that price wants to grab more liquidity before expanding higher.
However, the HTF order flow remains strongly bullish, so I will only be looking for long setups here.
📌 Game Plan
I will be targeting the $2.72 liquidity zone, which holds significant liquidity.
Additionally, I will watch for price to test the HTF key level and look for rejection from that area.
🎯 Setup Trigger
I will look for a 6H–4H break of structure before entering a trade (with LTF confirmation).
📋 Trade Management
Stoploss: 6H–4H swing low confirming the BOS
Targets:
• TP1: $3.14
• TP2: $3.38
• TP3: $3.67 (All-Time Highs)
💬 Like, follow, and comment if you find this setup valuable!
⚠️ Disclaimer: This content is for informational and educational purposes only and does not constitute financial, investment, or trading advice. Always do your own research before making any financial decisions.
