XRPAfter a strong surge at the beginning of 2025, XRP has entered a consolidation phase (sideways trend between 2.3 – 3.0 USDT). Momentum is weakening, as the last three weekly candles show lower highs. If the 2.33 USDT level holds, a rebound toward 2.74 – 3.00 could follow. However, if it falls below 2.30, it could open the way down to 1.80 or even 1.50 USDT.
Trade ideas

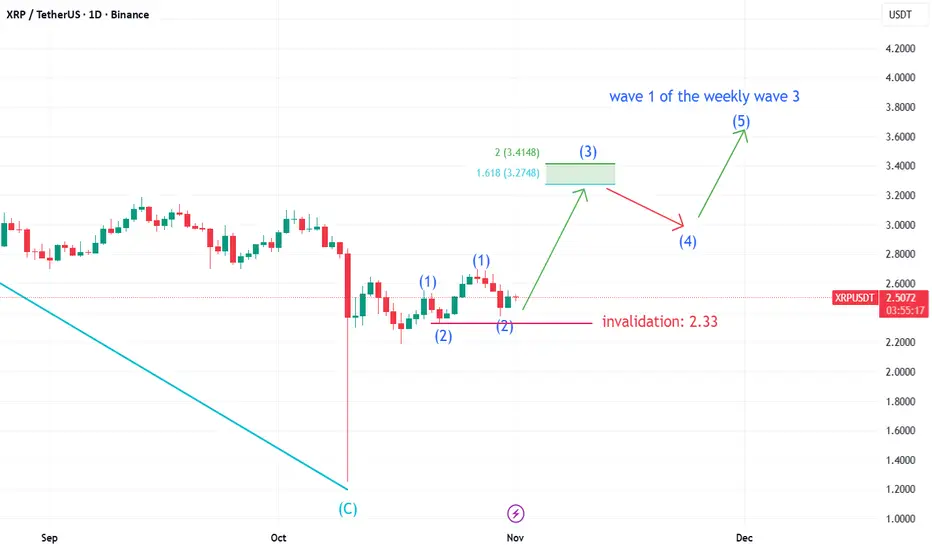
xrp elliot wave scenario daily timeframe (probability)For the full context, see my earlier post in how I count the elliot waves of xrp on the weekly timeframe.
Based on that count, this is the most probable elliot wave count on the daily timeframe.
There is a clear invalidation sitting at 2.33
Other scenario?
For a bearish scenario it would have to take out the start of the first wave 1 sitting at 2.19 which would make this current setup invalid and have to wait for more clarity.
Share your opinion! Peace!
$XRP (DAILY): SUPPORT ZONE has been FLIPPED into resistanceCRYPTOCAP:XRP is quickly becoming a BEAR MARKET coin, I'm afraid to say.
The 200 MA on the DAILY has rejected once again; the horizontal and golden pocket support levels have been flipped into hard resistance zones.
Also, both the 50 and 200 MAs (yellow and green) are not only acting as dynamic resistance in confluence with the horizontal one, they are poised for a DEATH CROSS as well.
HIDDEN BEAR RSI divergence recently on the DAILY and currently on the 4-HOUR chart. It looks like the rally from the 10/10 collapse bottom up to $2.7 a few days ago was just a DEAD CAT bounce (WAVE B), and WAVE C targeting $1.20s could be next.
And one of my favorites, the ELLIOT WAVE oscillator (white arrow), is showing a high chance of another WAVE downwards soon or next.
Shortable coin.
💙👽
#XRPArmy

Ripple on the Verge of a Heavy DropGiven the breakdown of the trend line (green line), the formation of a supply zone (orange zone), and the price pulling back to the supply zone with a reaction at the supply level, our first support area is the blue line zones. This is because, after breaking the trend line, the price tends to oscillate between the trend line and the next level. If the price breaks below the blue level, it will reach the marked areas, indicating that Ripple could potentially drop to around 1.16. BINANCE:XRPUSDT

XRP is about to skyrocket XRP is about to skyrocket, this is where the BIGGER INSTITUTIONS🏦 ACCUMULATED LONG POSITION,BUY XRP NOW

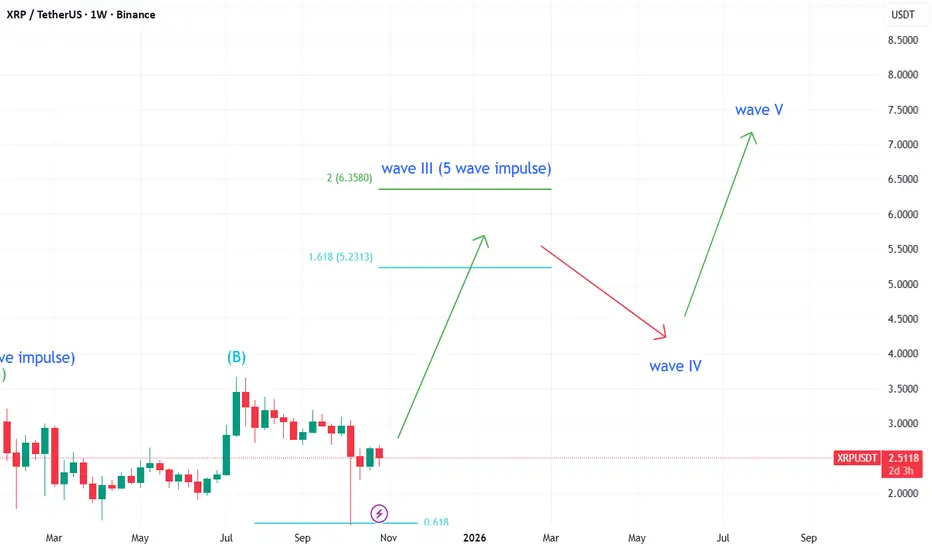
xrp elliot wave scenario (probability)XRP has finished 5 waves to the upside in a wave I towards 3.40
The second wave was a flat ABC as the most probable count, especially when looking at volume.
In this scenario, we are now ready for a third wave up in 5 impulse waves towards the golden fib target (1.618) at around 5.30
Other scenarios?
before the crash of october 10th, my count was les bullish. I had a wave I and II around 0.50 and the move towards 3.40 that is now my wave I, was my wave 3. Then a flat ABC in a wave 4 and was looking for a last leg up towards 4.20. BUT the crash invalidated this setup because a wave 4 is not allowed to touch the 0.618 of wave 3 which it did. Thats why current scenario is the most probable.
A bearish scenario would be another (bigger) crash towards 0.80 where wave 2 would touch the 0.88 fib level of wave 1 to be invalidated as this is not allowed in an impulse. Till that happens, the current setup has the most probability, in line with macro events like the spot ETF, Ripple Prime, rate cuts and quantitative easing.
Share your opinion! Peace!
Ripple (XRP): Looking For Breakout | Bullish SetupXRP is still sitting right below resistance, and what we’re waiting for here is a clean breakout before looking for any entries. Once that happens, the stop-loss would ideally sit just below the EMAs—but for now, it’s tricky to set one since they’ll shift as price develops.
A proper breakout with a confirmed retest would open the door for a clean long setup toward the next targets.
Swallow Academy

DeGRAM | XRPUSD seeks to the $2.4 level📊 Technical Analysis
● XRP/USD continues to trade under a major descending resistance trendline, facing repeated rejection near 2.70. Price consolidation beneath this zone signals waning bullish momentum.
● The pattern shows lower highs and potential for a corrective decline toward 2.38 support, aligning with prior reaction lows and structural confluence.
💡 Fundamental Analysis
● Investor caution remains as Ripple awaits further regulatory clarity post-SEC settlement, while broader crypto risk sentiment weakens amid dollar strength.
✨ Summary
● Short bias below 2.70; target 2.38. Failing momentum and macro headwinds reinforce bearish continuation.
-------------------
Share your opinion in the comments and support the idea with a like. Thanks for your support!

XRP - BIG OI Rise - we`ll take short in a caseXRP - BIG OI Rise - we`ll take short in a case
clear strucutre change
becasue such oi often end with big move

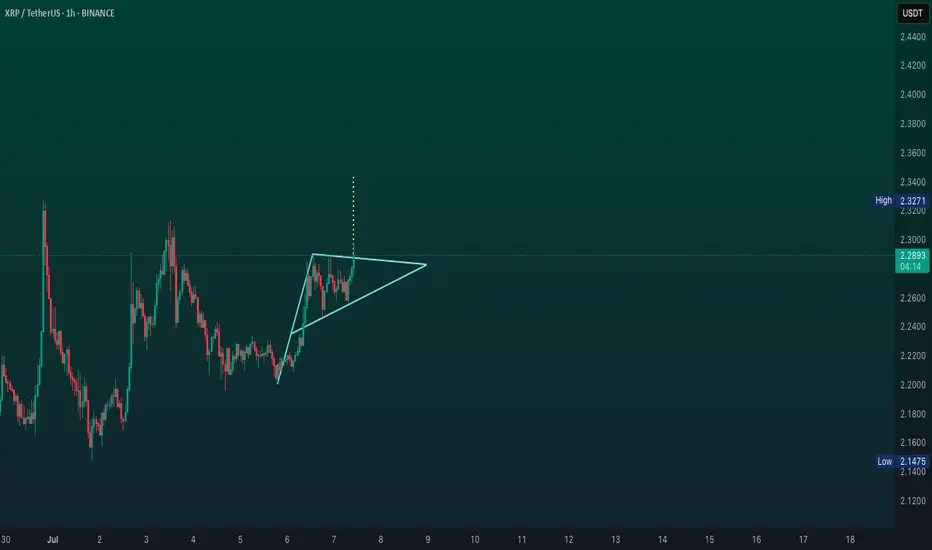
XRP hourly timeframe updateRipple CEO Brad Garlinghouse will testify at a July 9 U.S. Senate Banking Committee hearing on crypto market structure. This comes alongside proposed legislation to clarify SEC/CFTC jurisdiction over tokens like XRP, potentially resolving its multi-year regulatory limbo. Markets are pricing in reduced litigation risk after Ripple’s recent moves to integrate RLUSD stablecoin with institutional platforms like Hidden Road
Will XRP Form a Death Cross or Repeat July 2025 Rally?At the time of writing, XRP trades at $2.55, holding slightly above the crucial $2.54 support level. The altcoin needs renewed bullish activity to break through resistance at $2.64, which would confirm upward momentum.
If the Death Cross materializes, XRP could face a short-term correction, possibly dropping toward $2.35 or lower. Such a decline might trigger short-lived selling as traders react to the technical setup.
Conversely, if investor maturity continues to grow, XRP could replicate its July 2025 breakout. A successful push above $2.64 could propel the token toward $2.75 and potentially $2.85. This would invalidate the bearish outlook and reigniting bullish sentiment

#XRPUSDT: Swing Buy At 2.60, Possible Target At 3.50! We have strong bullish confirmation in smaller time frames that we can take a swing buy entry on XRPUSDT. There is a single major target at 3.50 but the price could move beyond that region. Please like and comment on the next cryptocurrency pair you would like us to analyse.
Team Setupsfx

XRP big reverse cup and handle?Is this the beginning of a reverse cup and handle?
If the pattern plays out, be ready for a drop to 1 dollar. If it breaks its triangle, then the 4 dollar price is in sight.

Will #XRP Make a Bullish Move or Is this Another Bull Trap?Yello, Paradisers! Are we about to witness a major #XRPUSDT breakout, or is this just another fakeout? Let’s dive deep into the real setup on the #XRPUSD chart:
💎#XRP is currently trading around $2.65, consolidating right below a critical resistance trendline. What’s building here is a textbook ascending triangle, and the squeeze is tightening fast and moving toward an inevitable breakout.
💎A clean breakout above the resistance trendline, especially if backed by increased volume and 50EMA continuing to act as dynamic support, will significantly raise the odds of a sharp move up. The first bullish target lies at $3.10 (moderate resistance). If bulls dominate, a fast continuation toward the $3.55 strong resistance is very much on the table.
💎However, and this is key, any rejection near the resistance without solid momentum could trap breakout traders. If #Ripple drops below the ascending trendline and loses the Support Zone near $2.37, the move will likely extend into the Key Demand Zone at $2.19.
💎Below $2.19? That’s where the bullish setup gets invalidated. We would then expect a potential full breakdown, creating a cascade of stop-loss triggers and panic selling. That’s not a dip you want to buy blindly. Bulls still hold short-term momentum, but the next few candles will decide everything.
Strive for consistency, wait for clear confirmations, and remember that discipline always beats chasing quick profits.
MyCryptoParadise
iFeel the success🌴

XRPUSDT.P - October 28, 2025Entry price is at 2.6375 with a market order; if price has moved slightly higher, consider placing a better limit order entry. Profit level is set at 2.6969, stop level at 2.5976, and move stop level to breakeven at 2.6614. Based on the recent consolidation and breakout attempt, this is a medium-risk setup due to moderate volatility and proximity of stop to recent swing lows.

XRP/USDT 1D Chart Review🔹 1. General Trend
A long-term downtrend is visible, confirmed by the descending trendline connecting the peaks (black diagonal line).
The price continues to respect this trend, and the current rebound looks like a test of this line from below.
🔹 2. Key Levels
✅ Resistance:
2.77–2.80 USDT – current strong resistance (being tested now, with the price trying to break through it).
→ This is the confluence zone: downtrendline + horizontal level.
2.85–2.86 USDT – next resistance (previous local high).
3.12 USDT – main weekly resistance, where the last major downward wave began.
✅ Support:
2.48 USDT – key daily support from which the market rebounded.
2.13 USDT – lower support that halted the earlier crash (large wick).
🔹 3. Stochastic RSI
Currently in the overbought zone (80–100), and the %K and %D lines are close to crossing.
→ This signals that upward momentum may be weakening – a local correction or consolidation is possible.
🔹 4. Scenarios
🟢 Bullish (breakout of resistance 2.77–2.80)
A confirmed breakout and close of the candle above 2.80 USDT will signal a continuation of the move to:
🎯 2.85–2.86 (first target)
🎯 3.12 (second target)
🔴 Bearish (rejection of resistance)
If the daily candle closes below 2.65 USDT, a possible pullback to:
🎯 2.48 (key support)
🎯 2.13 (deeper retest)

XRP Whales’ $500 Million Accumulation Pushes Price Past $2.5At the time of writing, XRP trades at $2.65, attempting to establish $2.64 as a new support floor. The token has climbed more than 12% in the past week, marking one of its strongest short-term rallies in months.
If bullish sentiment continues, XRP could extend its rise toward the $2.75 resistance level. Investor support, particularly from whales, may help drive the asset closer to the $3.00 mark, signaling a broader recovery phase.
However, if XRP faces renewed selling or bearish market cues, it could retrace to $2.54 or even $2.35. Such a decline would invalidate the current bullish outlook and suggest short-term exhaustion among investors.

XRPUSDT - BULLISH CONTINUATION IN SIGHTSymbol - XRPUSDT
XRPUSDT is making an attempt to break above the upper boundary of its trading range amid a broader bullish rebound across the cryptocurrency market. A confirmed breakout could develop after a short-term pullback.
The market continues to recover from the liquidation event of last week, with Bitcoin displaying structural strength - hinting at a possible return of bullish momentum. This supports a more optimistic outlook for the overall crypto sector.
Currently, XRPUSDT is testing resistance and entering a consolidation phase. The main breakout point sits near 2.661 However, during consolidation, a retest of support levels remains possible as the market may seek liquidity before a potential upside move.
Resistance levels: 2.661, 2.739
Support levels: 2.587, 2.547, 2.500
Since the beginning of the session, momentum has remained notably strong, though a short correction could occur before the upward trend resumes. During this corrective phase, XRPUSDT may retrace toward the 2.587 – 2.500 zone to gather liquidity before continuing higher.
BUTTERFLY BEARISH PATTERN FOR XRPI've check XRP and its making a butterfly bearish pattern. (4 hour time frame)
- As we can see in our TA. The price is increasing but the RSI is going down. It is showing weakness.
We might see a short term bearish movement for XRP. Lets wait for more signals to come for us to support our technical analysis. Stay tuned! I'll be updating this technical analysis if we see more signal to come.
Lets go! Trade at your own risk and always do your own research!

XRPUSDT → Pre-breakout base. Are the bulls back?BINANCE:XRPUSDT is attempting to break through the resistance of the trading range as part of a bullish run across the entire market. There is a chance that a breakthrough could form after a pullback...
The market is gradually buying back the liquidation that occurred on October 10. Bitcoin is breaking the structure, which indicates a possible return of the bulls. This sets a positive tone for the cryptocurrency market.
XRP is testing resistance and entering a consolidation phase. The trigger that could provoke growth is 2.661. However, as part of the consolidation, the market may test support before growth in order to hunt for liquidity.
Resistance levels: 2.661, 2.739
Support levels: 2.587, 2.547, 2.500
Since the opening of the session, the market has formed a fairly strong momentum, and at the beginning of the European trading session, a correction may form before the growth continues. As part of the correction, XRP may form a pullback to 2.587 - 2.500.
Best regards, R. Linda!

[SeoVereign] RIPPLE BEARISH Outlook – October 27, 2025Hello everyone,
This idea presents a bearish (short) outlook on Ripple (XRP).
Currently, Ripple has reached a major resistance zone following a short-term upward movement,
and from a technical standpoint, a corrective phase is likely to occur.
Basis — BEARISH BAT PATTERN (Alternate Bat Pattern)
Structurally, Ripple has entered the PRZ (Potential Reversal Zone) of a Bearish BAT Pattern.
This zone coincides with a price range that has historically shown strong selling pressure,
and typically, a downward reversal tends to occur once the pattern is completed.
Accordingly, the average target price is set around 2.3 USDT.
This perspective is based on data as of October 27,
and further detailed updates will be provided depending on future price developments.
Thank you for reading.

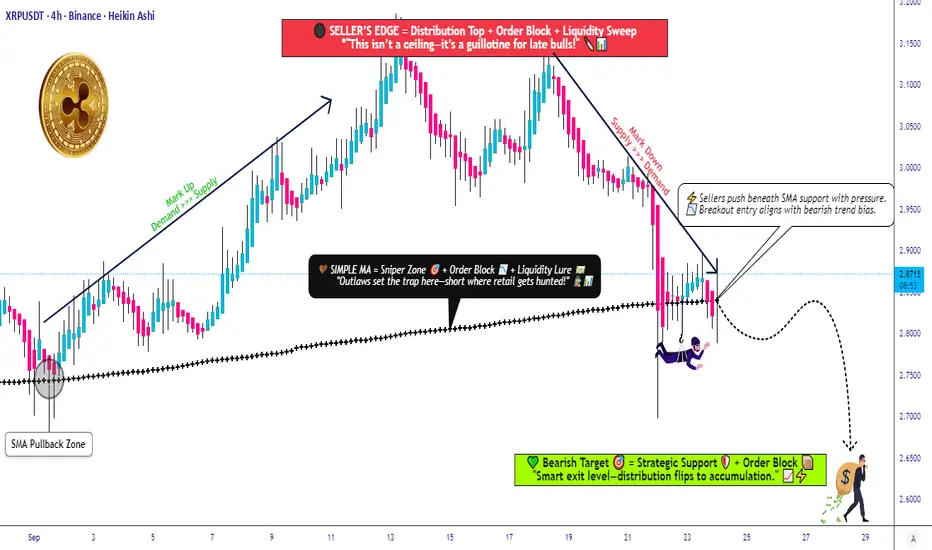
Ripple vs Tether: Key Technical Levels Every Trader Should WatchXRP/USDT | "RIPPLE vs TETHER" Market Wealth Strategy Map (Swing/Day Trade)
📊 Plan:
We’re eyeing a bearish confirmation if candles break below the 0.786 Fibonacci zone + SMA breakout @ 2.8300. At that point, sellers could gain momentum and dominate short positioning.
💡 Thief Strategy Highlight → Using a layered entry style (multiple limit orders). This method allows staggered entries rather than “all-in at once.”
🎯 Layered Short Entries (Sell Limits):
2.9300
2.9000
2.8800
2.8600
(You can expand layers based on your own strategy adjustment.)
🛑 Stop Loss (Thief SL):
Placed near 3.0000 — but ⚠️ please note: Risk management is personal. Thief OG’s — make your own choices. My SL is just an example.
✅ Target (Thief TP):
The “police barricade” (aka strong resistance zone with overbought pressure + possible trap) aligns around 2.6500. That’s where profit-taking may be wise before liquidity hunters catch us.
Again, this is flexible — adjust TP to your own risk/reward plan.
🔗 Related Pairs to Watch
$BTC/USDT → Major market leader, XRP often follows Bitcoin’s momentum.
$ETH/USDT → Correlation with altcoin sentiment; strong ETH moves ripple across XRP.
$ADA/USDT & $SOL/USDT → Competing Layer-1s, often mirror similar retail/institutional flows.
$XLM/USDT → Direct cousin of XRP, highly correlated in macro movements.
Watching these can help confirm broader market bias & correlation flows.
✨ “If you find value in my analysis, a 👍 and 🚀 boost is much appreciated — it helps me share more setups with the community!”
⚠️ Disclaimer: This is a Thief style trading strategy shared just for fun & community engagement. Not financial advice. Manage your own risk, make your own decisions.
#XRP #Ripple #CryptoTrading #SwingTrade #DayTrading #Fibonacci #TechnicalAnalysis #CryptoCommunity #TradingStrategy
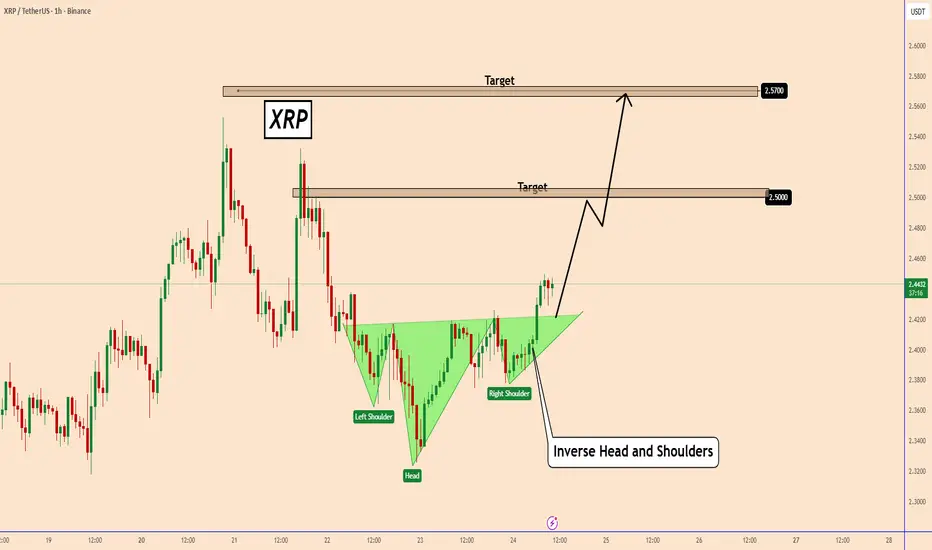
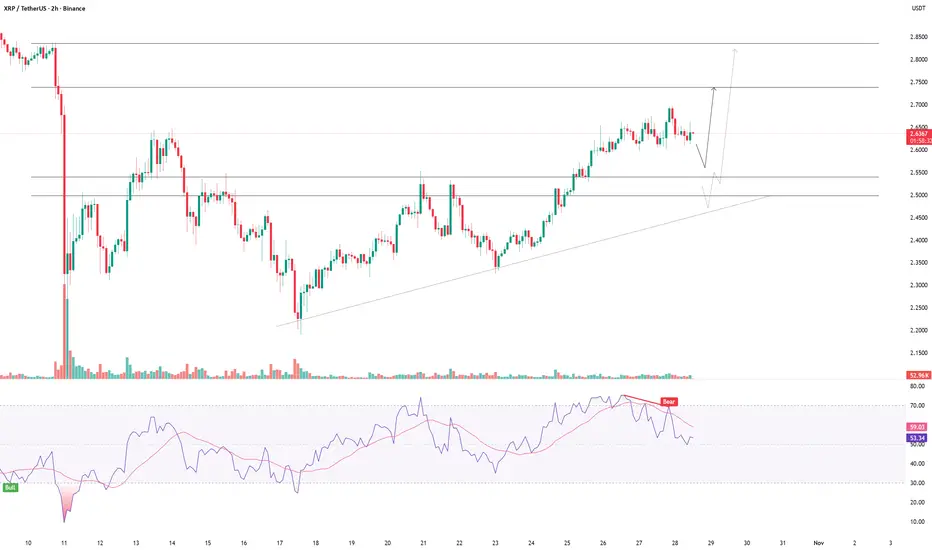
XRP Prepares to Resume Uptrend with an Inverted H&SH PatternXRP Prepares to Resume Uptrend with an Inverted H&SH Pattern
On the 60-minute chart, XRP confirmed a clear bullish pattern. The price has already broken out of the neckline of an Inverted Head and Shoulders pattern, indicating that the bullish trend is emerging again.
If the price holds strong around this area, there is a good chance that XRP will perform well in this short-term trading setup, possibly reaching targets today or over the weekend.
Main targets:
2,500
2,570
You may find more details in the chart!
Thank you and Good Luck!
❤️PS: Please support with a like or comment if you find this analysis useful for your trading day❤️