XTZ/USDT A Pattern of Strength in Market Weakness📍 The chart is forming a Livermore-style expanding wedge —
a structure where each price swing grows wider, and volatility increases.
📌 The current zone may be a key turning point for the trend.

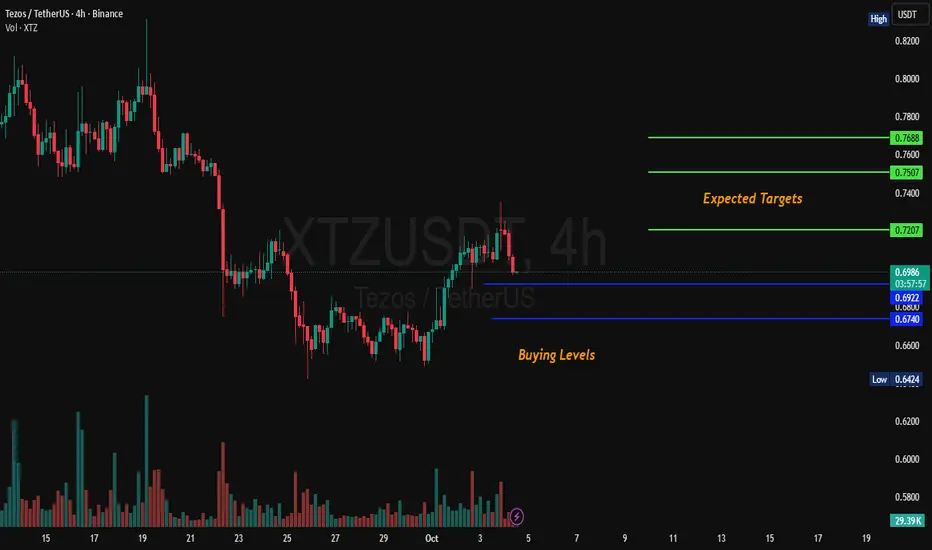
XTZ 4H Analysis XTZ Has started upward momentum. Key buying area are marked as 0.682 & 0.675. Possible targets are also given on the chart. NFA DYOR

Long trade 📘 Trade Journal Entry
Pair: XTZ/USDT
Date: Sun 5th Oct 25
Time: 4.30 pm
Session: NY to Tokyo Session AM
Direction: Buyside Trade
Timeframe: 30m
🔹 Trade Details
Entry: 0.7112
Profit Target: 0.8328 (+17.10%)
Stop Loss: 0.6933 (–2.52%)
Risk-Reward Ratio (RR): 6.79
🔹 Technical Context
Structure: Pric

Tezos long to $0.801 todayI entered this tezos position last night/early morning. Just scale in a while ago and adjusted sl to $0.7770
tp is $0.8010
Anticipating a continuation push to the upside soon. Setup also is in confluence with an inverse head and shoulder pattern

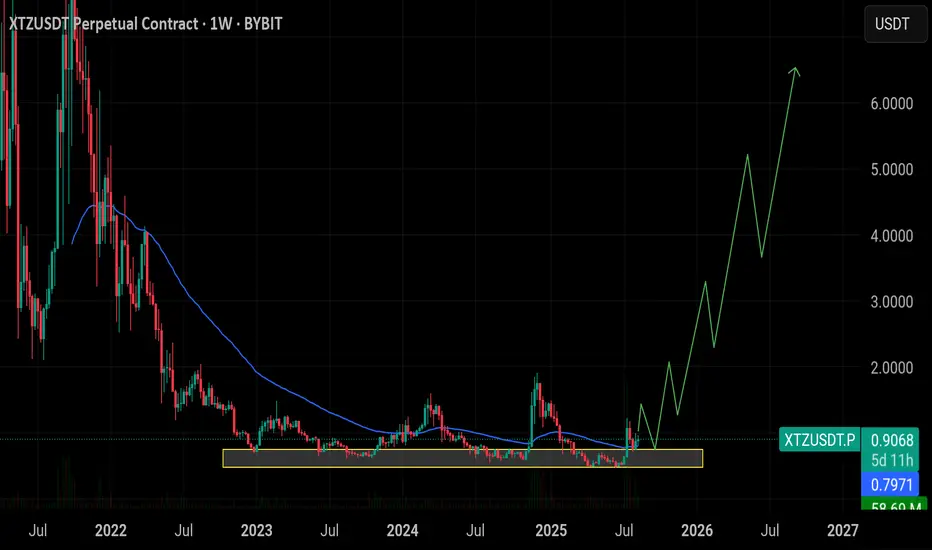
XTZ Secondary Trend. Channel. Wedge. Capitulation Zone. 07 05 20Logarithm. Time frame 1 week (less is not necessary).
The secondary trend has formed a horizontal channel for several years, with repeating wedge-shaped formations, the third time we entered under the support of this channel not by squeezes to collect long stop-loss, but by full candles and the st

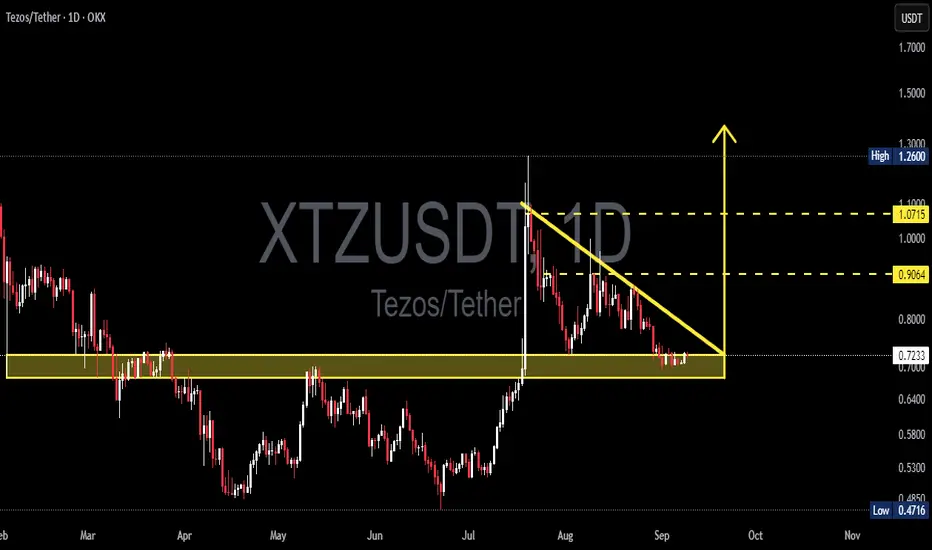
XTZ/USDT — Descending Triangle at a Critical Zone!Tezos (XTZ/USDT) is currently trading at a decision point. The chart shows a clear Descending Triangle pattern formed since late August, with price consolidating right above the major support zone at 0.64 – 0.74 USDT.
This structure is generally considered bearish, as consistent lower highs indicat

Is #XTZ Ready For a Major Breakout or Another Trap Ahead?Yello Paradisers! Are you prepared for what might be one of the sneakiest reversals brewing quietly on #XTZUSDT? Let's see the current setup of #Tezos:
💎#XTZ is trying to break out of a descending broadening wedge formation, a setup that typically signals the end of a corrective structure and the p

$XTZ Long-Term Accumulation AnalysisSEED_DONKEYDAN_MARKET_CAP:XTZ Long-Term Accumulation Analysis
🔸XTZ has been consolidating in a major accumulation zone between $0.50 – $0.76 for a long period, showing strong demand at lower levels. Current price is above this range, suggesting patience is needed for the bulk of entries — but part
See all ideas
Summarizing what the indicators are suggesting.
Oscillators
Neutral
SellBuy
Strong sellStrong buy
Strong sellSellNeutralBuyStrong buy
Oscillators
Neutral
SellBuy
Strong sellStrong buy
Strong sellSellNeutralBuyStrong buy
Summary
Neutral
SellBuy
Strong sellStrong buy
Strong sellSellNeutralBuyStrong buy
Summary
Neutral
SellBuy
Strong sellStrong buy
Strong sellSellNeutralBuyStrong buy
Summary
Neutral
SellBuy
Strong sellStrong buy
Strong sellSellNeutralBuyStrong buy
Moving Averages
Neutral
SellBuy
Strong sellStrong buy
Strong sellSellNeutralBuyStrong buy
Moving Averages
Neutral
SellBuy
Strong sellStrong buy
Strong sellSellNeutralBuyStrong buy
Displays a symbol's price movements over previous years to identify recurring trends.