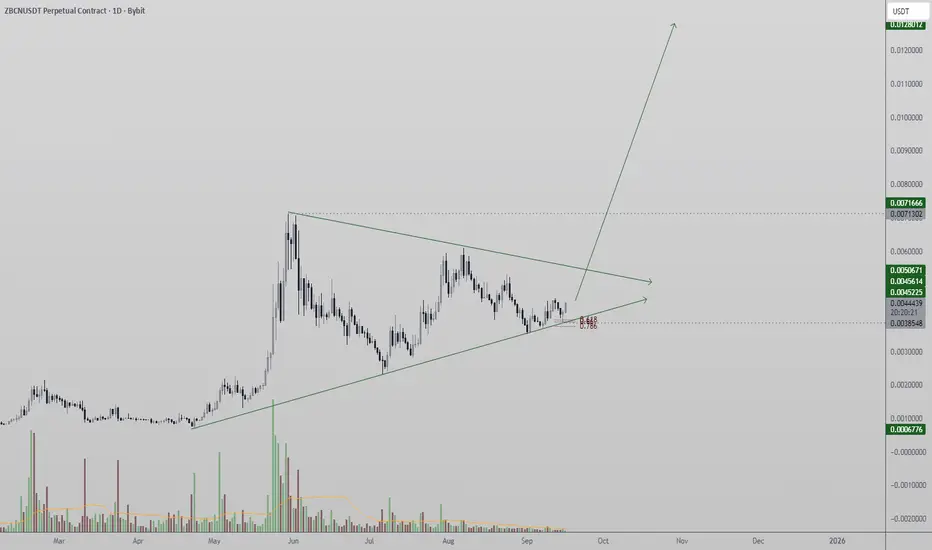
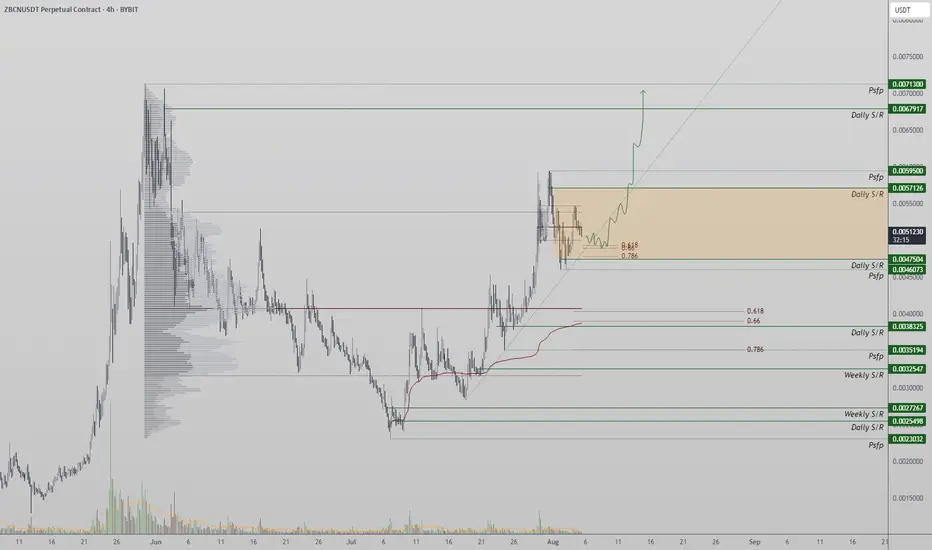
Zebec long at 0.0039 going for 1:12RRGiven the recent correction due to uncertainty regarding the future of trade with China and Trump's news driver
www.bbc.com
Entry at 0.0039
Stop Loss at 0.0012
Exit at 0.0100
-Target is set at -3.5 Standard deviation from bullish daily orderblock at 0.0027-
Please trade responsibly! Use proper risk and management. Bring stop loss to break even when 10% of target is achieved!
Trade ideas

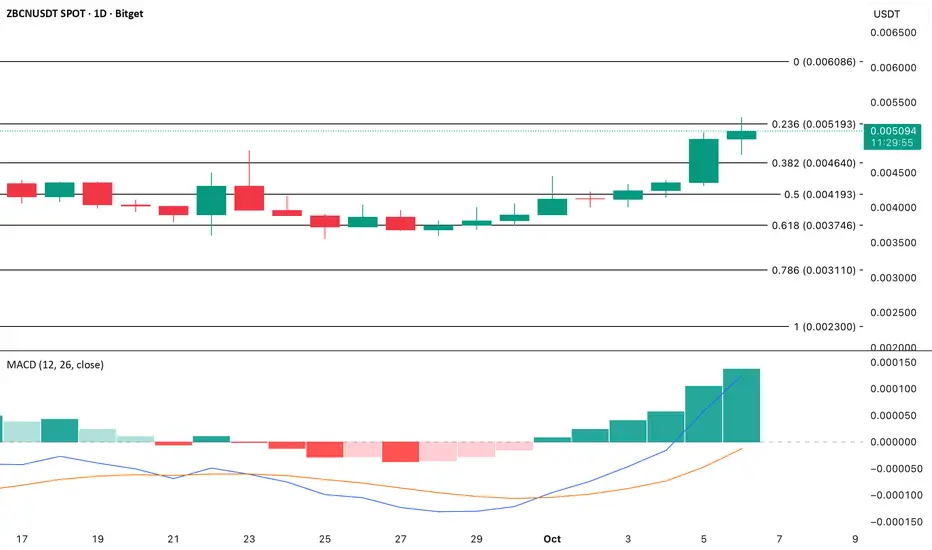
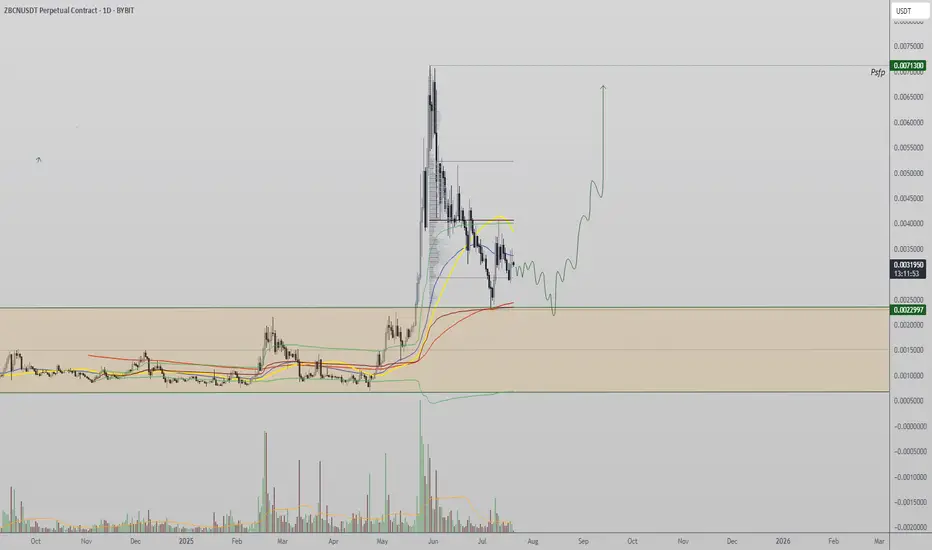
ZBCN: Bullish Momentum Builds as MACD Signals Continued Strength
ZBCN the token powering the decentralized infrastructure (DePIN) protocol Zebec, has climbed 36% in the past week — emerging as one of the top-performing U.S.-based cryptocurrencies to watch.
On the daily chart, technical indicators show promising momentum. The Moving Average Convergence Divergence (MACD) — a tool that measures the relationship between two moving averages of price to gauge trend strength and direction — shows the MACD line (blue) positioned above the signal line (orange).
This bullish setup confirms the strength of ZBCN’s ongoing uptrend. If buying pressure sustains, the token could push further upward in the coming days.
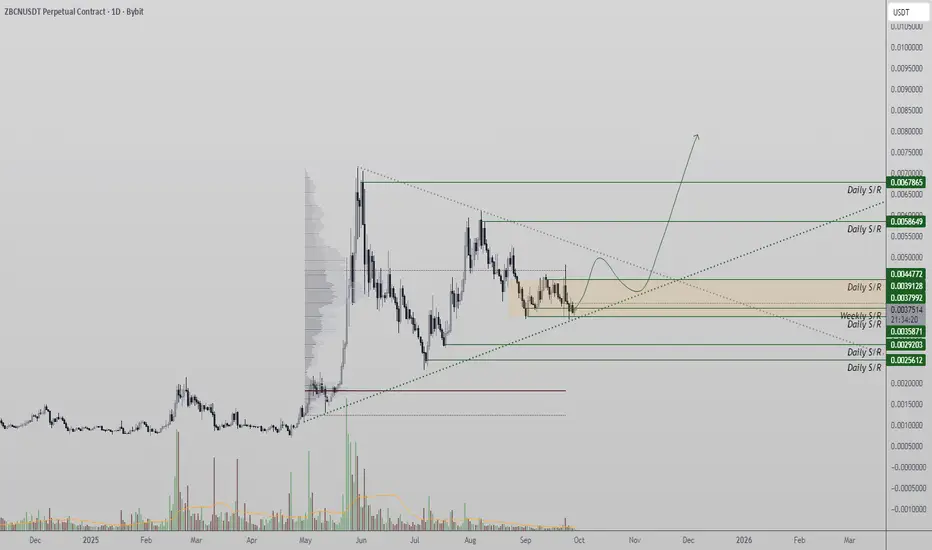
ZBCN – Weekly Equilibrium Holds as Bulls Defend SupportZBCN continues to consolidate within its weekly equilibrium, with price action forming higher lows and holding above dynamic support. Bulls remain in control as long as this structure is preserved.
The asset remains locked within a tight apex structure on the weekly timeframe. This consolidation suggests that the market is preparing for a larger move, though the exact timing will likely require multiple weeks of development.
Key Technical Points:
- Weekly equilibrium pattern remains valid above dynamic support.
- Price action is printing consecutive higher lows, reinforcing bullish structure.
- Potential bounce expected from current levels into daily support before further rotation.
ZBCN’s market structure remains healthy despite the lack of a confirmed breakout from the weekly equilibrium. The dynamic support level continues to provide a strong foundation, with each higher low acting as confirmation of bullish intent. Current price action suggests a bounce is forming, potentially targeting daily support before another rejection creates rotational movement.
This type of consolidation is common during equilibrium phases, where market participants accumulate positions while awaiting a volatility expansion. The apex has yet to be resolved, meaning traders should remain patient as ZBCN builds its base.
What to Expect in the Coming Price Action:
If support levels hold, ZBCN is likely to continue forming higher lows and maintain its bullish equilibrium. A sustained breakout from the apex would confirm trend continuation, while a breakdown below dynamic support would invalidate the structure.
ZBCNUSDT – Possible Push Higher?ZBCN is trending today, and momentum could drive the price higher. Where there’s hype, there’s often opportunity. Let’s keep an eye on price action and see how this plays out! 🚀
ZBCN breakout Descending channel!!ZBCN bounced perfectly off the bottom trend line, breaking out of the descending channel, aiming to push toward the upper trend line.

ZBCN Defends Daily Support, Reversal Still in PlayDespite corrective pressure, ZBCN has respected its critical daily support zone. The 0.618 Fibonacci level, point of control, and VWAP support all align here, creating a high-confluence region where bulls may reassert control.
Key Technical Points
- Daily Support Holding: Price remains above key confluence.
- Support Confluence: 0.618 Fibonacci + VWAP + point of control.
- Risk Scenario: Losing this region risks deeper correction.
The correction into this zone is technically healthy, as long as support holds. Consecutive higher lows remain intact, reinforcing the uptrend. However, should this region break, price could face significant downside.
The VWAP slicing through the Fibonacci retracement adds weight to this level, historically known for bullish reactions. A reversal from here would maintain market structure and could rotate price higher.
What to Expect
ZBCN is at a critical pivot. A rebound keeps the bullish structure alive, but a breakdown risks further correction. Traders should watch volume inflows to confirm reversal strength.
ZBEC Network (ZBCN) Holds Dynamic SupportZBCN price action remains constructive despite recent corrections, as it continues to respect a dynamic support zone that has generated consecutive higher lows. This region has historically served as a base for bullish reversals, and its defense will determine whether price can rotate back toward channel resistance.
Key Technical Points
- Dynamic Support: Price holding at a critical level that has anchored the uptrend.
- Higher Lows Intact: Structure remains bullish as long as this base holds.
- Channel Resistance Target: Breakout requires strong bullish inflows.
ZBCN has established a pattern of higher lows since the base of its previous impulsive rally. Each test of dynamic support has resulted in a bounce, underscoring its importance in sustaining the broader trend.
From a technical perspective, the current region represents a critical inflection point. A rebound here would keep the bullish structure intact and open the path toward the channel’s dynamic resistance. However, failure to hold this zone could compromise the trend, signaling deeper corrective action.
The channel itself continues to frame price action, providing both resistance and support. Traders will be watching for a retest of the upper boundary, which would confirm renewed strength in momentum.
What to Expect in the Coming Price Action
ZBCN sits at a pivotal support zone. As long as dynamic support holds, the bullish case remains valid with a likely rotation toward channel resistance. Traders should watch for volume confirmation to validate the move. A breakout above resistance would signal strength for further expansion, while failure to defend support risks unwinding the bullish structure.

ZBCN Approaches Apex as Dynamic Supports ConvergeZBCN has entered a compression phase, where converging supports and resistances are creating an apex formation. This typically precedes a breakout or breakdown, with the outcome likely to set the directional bias for the weeks ahead.
Key Technical Points
- Equilibrium Phase: Dynamic support and resistance converging into an apex.
- Support Cluster: 0.618 Fibonacci, VWAP support, and value area low.
- Bullish Bias: Higher highs and higher lows remain intact.
ZBCN is at a critical inflection point. The 0.618 Fibonacci retracement aligns with the value area low and VWAP support, forming a powerful support cluster. Price must defend this area for the bullish structure to remain valid.
Daily candles highlight this zone as a key decision point. Reversal here could maintain bullish momentum and set up a rally into higher resistance, while a breakdown would invalidate the bullish structure.
What to Expect
The apex structure will soon resolve. A bounce from current levels supports continuation, while a failure opens the door for deeper correction. Traders should watch for volume to confirm the move.

ZBCN Builds Apex Structure as Breakout ApproachesZBCN continues to consolidate in an equilibrium structure, coiling between support and resistance. The apex is nearing, suggesting a decisive move is imminent.
After weeks of balanced trading, ZBCN has developed a converging structure that will soon resolve. Technical indicators point to continued bullish bias as long as support holds.
Key Technical Points:
Trading in equilibrium with converging support and resistance.
Apex forming, signaling potential breakout.
Bounces from channel support reinforce bullish bias.
ZBCN has respected both support and resistance lines, creating an equilibrium pattern. Each test of channel support has resulted in strong rebounds, reinforcing the bullish narrative.
As the range tightens, a breakout becomes increasingly likely. Historical behavior in similar setups suggests that when equilibrium resolves, price action typically accelerates toward the prevailing trend—in this case, bullish.
What to Expect in the Coming Price Action:
ZBCN is likely to break higher once the apex resolves, targeting much higher levels if bullish momentum follows through. A loss of channel support, however, would delay this scenario.
ZBCN Builds Bullish Pressure as Market Awaits BreakoutZBCN has been consolidating within a tightly controlled equilibrium zone, with support and resistance converging into an apex structure. Market sentiment leans bullish, but a decisive move awaits volume confirmation.
The recent consolidation of ZBCN reflects a high-control equilibrium, with price compressing into a narrowing range. This structure has created an APEX zone, a critical inflection point where the next move — bullish or bearish — will be determined. Market structure currently favors the bulls, but the lack of confirming volume has delayed a breakout.
Key Technical Points:
- APEX Zone Forming: Support and resistance are converging tightly, creating a breakout setup.
- Volume Profile Weakness: Current volume has been declining, suggesting traders are waiting for confirmation.
- Bullish Bias: Consecutive higher highs and higher lows tilt the odds toward an upside resolution.
From a technical perspective, the formation of consecutive higher highs and higher lows signals growing bullish momentum. This structural evolution has increased the likelihood that the APEX zone resolves upward. Still, the critical factor is the volume profile — a breakout without strong bullish inflows is unlikely to sustain.
If volume expands alongside a decisive break above resistance, ZBCN could accelerate sharply as sidelined liquidity enters. Traders should remain cautious, as apex setups can also trigger sudden downside flushes if support gives way.
What to Expect in the Coming Price Action
ZBCN is approaching a pivotal decision point. A volume-backed breakout above resistance would validate the bullish structure and open the door for continuation higher, while failure to hold support could trap late longs.

ZBCN Tests Key Daily Support With Potential for BreakoutZBCN price action is consolidating at a critical daily support zone, a level reinforced by the value area low and the 0.618 Fibonacci retracement. This region has already been retested multiple times, highlighting its importance as a structural pivot. Despite the repeated pressure, bulls remain in control as long as this support is maintained. A sustained defense could provide the catalyst for continuation higher.
ZBCN Price Technical Points:
- Daily Support Zone: ZBCN is trading at daily support aligned with the value area low.
- 0.618 Fibonacci Confluence: Price action has breached this level intraday, but bulls continue defending it.
- Volume Confirmation Needed: A rally requires bullish inflows to reverse the current volume decline.
The daily support zone currently being tested by ZBCN is critical for maintaining its bullish trajectory. Its alignment with both the value area low and the 0.618 Fibonacci retracement creates a high-confluence region. Price briefly breached this level on a closing basis, but the market has so far failed to generate follow-through selling pressure, suggesting that buyers remain active.
From a structural perspective, this support test provides an opportunity for another higher low to form. Such retests are often healthy within bullish trends, as they confirm the strength of demand zones. However, the absence of volume confirmation is concerning. A clear decline in the volume profile suggests that participation is thinning, which may delay a strong upside reaction until inflows return.
For ZBCN to initiate a move toward its all-time high, volume will be the decisive factor. Strong bullish inflows paired with decisive candles are necessary to confirm conviction and momentum. Without this validation, the market risks extended consolidation around the current level, testing the patience of participants before a breakout occurs.
What to expect in the coming price action:
If ZBCN holds the current daily support and volume inflows return, the probability of a rotation toward the all-time high increases significantly. Failure to attract demand could see price stall or retest lower supports.
Why ZBCN can push into new all-time high territoryZBCN has maintained a strong bullish posture over the weekend, with price action now approaching a key resistance zone. This region aligns with both the channel midpoint and the value area high, making it a critical level to monitor. Momentum remains on the side of the bulls, and the next few sessions will likely decide whether ZBCN pushes into new all-time high territory.
Key Technical Points:
- Channel Midpoint & Value Area High: Current resistance zone that price is pressing into.
- Bullish Volume Requirement: A breakout above this region must be supported by increasing -volume to validate continuation.
- All-Time High Target: A successful reclaim of value area highs sets up conditions for price discovery into new highs.
Over the weekend, ZBCN showed impressive resilience as price rotated higher into the upper half of the channel. The midpoint of the channel, which is also confluent with the value area high, is acting as an immediate barrier. Historically, this zone has served as a pivot point, and whether price gets accepted above here will determine the strength of the continuation.
The decisive factor remains volume. Sustained influxes of bullish participation are needed to confirm a true breakout rather than a temporary deviation. Should buyers defend this area on a closing basis, the probability of acceleration toward the all-time high resistance strengthens significantly.
Overall, the structure continues to favor the bulls. The prevailing uptrend has respected support zones consistently, suggesting that demand underpins the move. As long as higher lows remain intact and volume confirms momentum, ZBCN is positioned to extend toward price discovery levels.
What to Expect in the Coming Price Action:
If ZBCN reclaims the value area high with conviction, momentum could quickly accelerate into new all-time highs. Traders should watch for volume confirmation above this region to validate the breakout. Failure to reclaim could trigger short-term consolidation, but the broader trend bias remains strongly bullish.
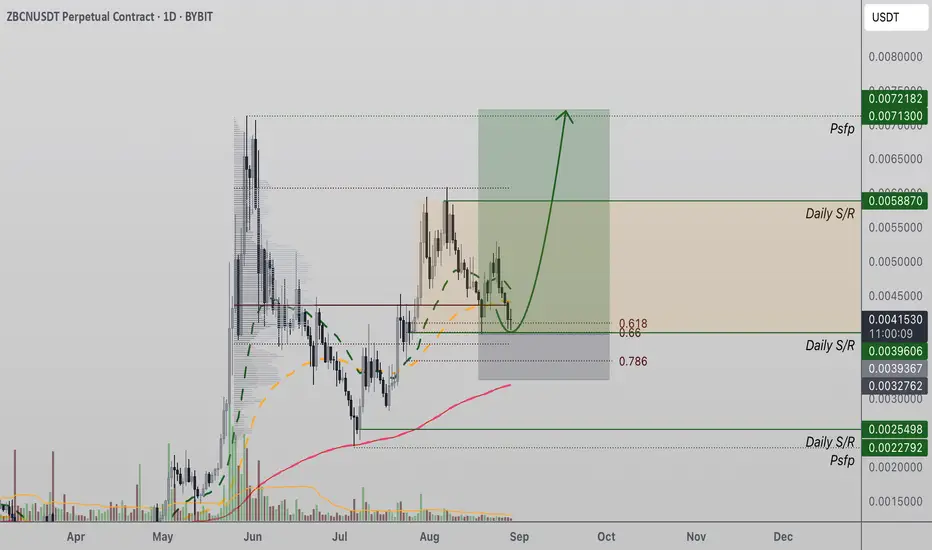
ZBCN Breaks Downtrend With Bullish Retest, Eyes UpsideZBCN has reclaimed critical support at the 0.618 Fibonacci retracement after breaking out of its local downtrend. With a bullish retest confirmed, the token now faces the Point of Control as the next hurdle before price can accelerate toward its prior swing high and beyond.
ZBCN’s price action has shifted momentum after a prolonged local downtrend. This week, the token found support at the 0.618 Fibonacci retracement, a level that often acts as a defining pivot in trend reversals. With a successful reclaim of the value area low, the technical picture is tilting toward the bullish side. Now, the focus turns to the Point of Control (POC), which stands as the decisive level that must be cleared to unleash further upside momentum.
Key Technical Points
- Major Support: 0.618 Fibonacci retracement level, aligned with this week’s structural low
- Bullish Retest: Reclaim of the value area low strengthens the case for upward continuation
- Critical Hurdle: Point of Control (POC) remains the barrier before expansion higher
ZBCN’s recent breakdown from its local downtrend has been met with immediate absorption at a high-probability support zone. The 0.618 Fibonacci retracement, a level closely watched by traders, has proven to be the defining floor for this week’s price action. This bounce not only established a local low but also reclaimed the value area low, signaling that buyers are stepping back into control.
The current challenge lies at the Point of Control, which has historically served as a heavy zone of price acceptance. Unless this level is broken with convincing volume, ZBCN’s momentum may remain capped. However, technical structure now favors the bulls: the downtrend has been invalidated, market structure is shifting, and the consolidation above support suggests accumulation rather than distribution.
Volume analysis also supports this thesis. Declining bearish volume during the move into support, followed by stronger bullish reactions, highlights a potential transfer of control. If volume increases during a push through the POC, ZBCN could accelerate quickly toward its prior swing high. Beyond that level, price discovery may extend further, particularly if momentum builds from renewed market participation.
What to Expect in the Coming Price Action
As long as ZBCN holds the 0.618 Fibonacci retracement as its structural low, the technical outlook favors continuation higher. A clear break and acceptance above the Point of Control would confirm the bullish trend’s next phase, setting up a strong move toward the swing high and potentially into new expansion levels. Conversely, failure to hold the reclaimed support could delay the upside, but for now, the market bias remains tilted toward the bulls.

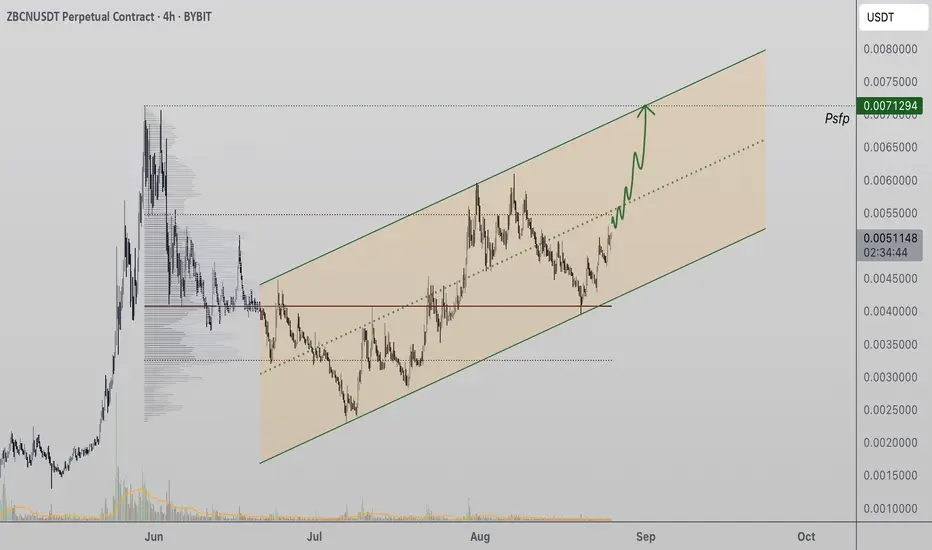
ZBCN Eyes Bullish Rotation as Key Fibonacci Support HoldsZBCN price action remains bullish as it holds above a critical 0.618 Fibonacci support level. Sustained buying momentum could trigger a strong rotation toward higher channel resistance levels.
ZBCN continues to trade within an established ascending channel, showing resilience at a high-value technical support zone. As long as this structural support remains intact, bullish continuation remains the likely scenario, with the potential for acceleration if volume strengthens.
Key Technical Points:
- Key Support: 0.618 Fibonacci level in confluence with channel support.
- Trend Structure: Price continues to respect ascending channel dynamics.
- Upside Potential: Room for rotation toward channel highs if support holds.
Price action on ZBCN has respected the ascending channel’s lower boundary, with recent tests confirming demand at the 0.618 Fibonacci retracement. This level acts as a crucial pivot for maintaining the current bullish market structure.
So far, price has not breached this support, indicating that bulls are still in control. As long as this base remains intact, the path of least resistance is to the upside. Market structure continues to post higher highs and higher lows, reinforcing the probability of a bullish rotation.
Volume remains a key factor to watch. Sustained upside acceleration will require stronger bullish influxes into the volume profile. Without this, price action could see slowed momentum or short-term consolidation before attempting a breakout. However, recent price reactions suggest underlying demand remains present, supporting further upside potential.
A decisive move away from the current support zone could fuel a rally toward the upper boundary of the channel, where sellers may once again test bullish strength. This area represents the next significant challenge for the current uptrend.
What to Expect in the Coming Price Action:
If ZBCN maintains support at the 0.618 Fibonacci level, a rotation toward the channel highs is likely. A volume-backed breakout could extend the rally further, while a breach of support would negate the bullish setup.
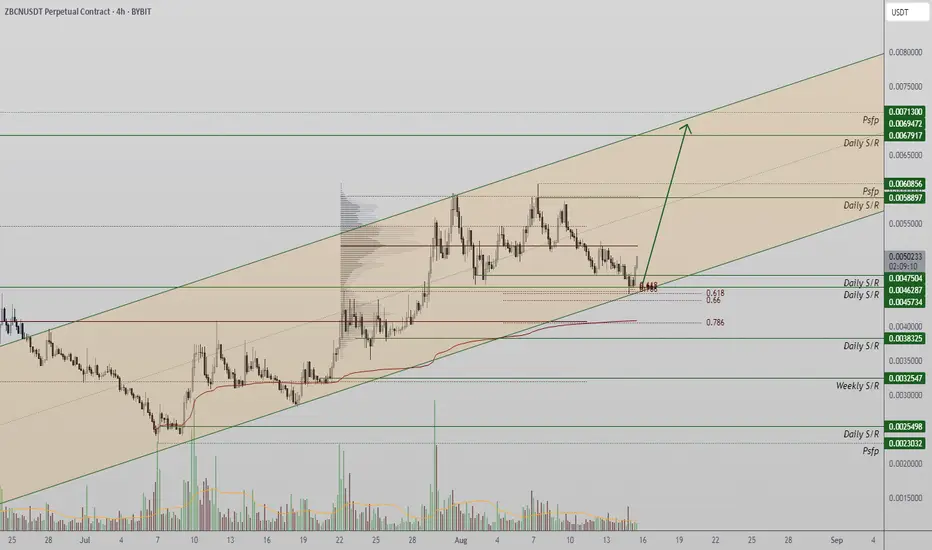
ZBCN Tests Channel Support as Bulls Look for Impulsive ReversalZBCN is trading at the lower boundary of its ascending channel, a structural support that has historically triggered impulsive rallies. Holding this level could pave the way toward new all-time highs.
ZBCN has maintained a consistent bullish structure, trading within an ascending channel that reflects vertical accumulation. Price is now pressing against the support end of the channel, a region that has previously acted as a launchpad for sharp upside moves. A rebound here would confirm the channel’s integrity and likely set the stage for another leg higher.
Key Technical Points:
- Support Zone: Lower boundary of ascending channel
- Structural Importance: Maintaining a higher low keeps bullish trend intact
- Upside Potential: Respecting support opens the path to new all-time highs
From a technical perspective, ZBCN’s current position is critical. The lower channel boundary acts as structural support, and its defense is necessary to maintain the series of higher lows that define the current uptrend. Historically, every test of this support has led to an impulsive rally, with price accelerating quickly back toward the channel high.
A similar reaction now would keep the bullish market structure intact and potentially target new all-time highs. If the bounce occurs with strong volume, it would further validate the channel pattern and add conviction to the bullish scenario.
Failure to hold this level, however, would represent a break in structural integrity and could lead to a shift in market sentiment. In that case, price might look for support lower in the range, delaying any attempt to push into new price territory.
Given ZBCN’s historical behavior within this pattern, traders should watch closely for early signs of reversal — such as bullish candle formations, reclaiming nearby short-term resistance, and increasing buying volume.
What to Expect in the Coming Price Action
If the ascending channel support holds, an impulsive rally toward the upper channel boundary is likely. Breaking the structure would shift bias to neutral until a new higher low is established.

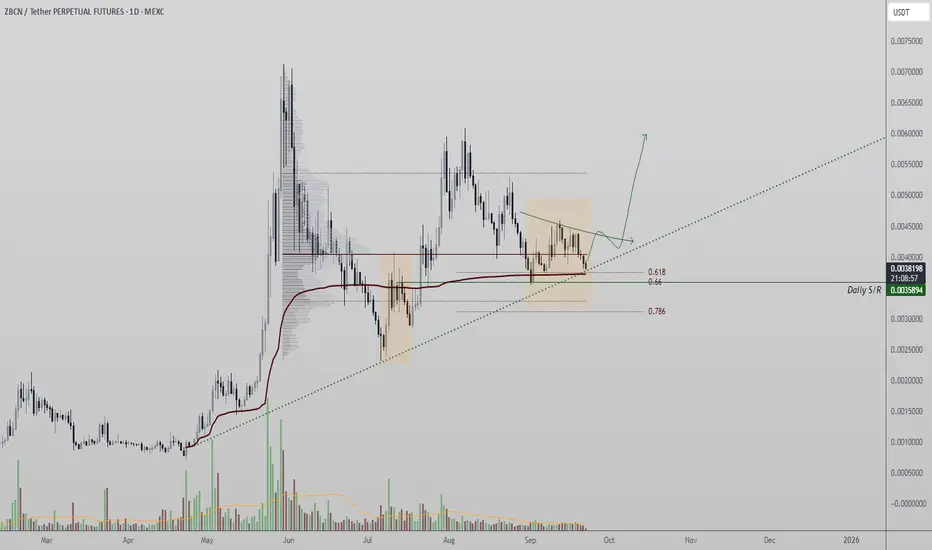
ZBCN Holds Structure at Support as Correction Continues ZBCN is consolidating just above the value area high as it undergoes a corrective phase. Despite the short-term pullback, the broader bullish structure remains intact while key support levels hold.
ZBCN has entered a technical consolidation following its recent rally, pausing near the high of its established value area. This correction is forming a potential equilibrium structure, and whether support holds or breaks will define the next directional move. Traders should be watching the current daily support zone closely, as it may act as the base for the next upward leg if the trend continues.
Key Technical Points:
- Support Zone: Daily SR level with 0.618 Fibonacci confluence
- Key Resistance: Swing high from previous rally
- Failure Point: Below daily support opens downside toward point of control
ZBCN’s price action is currently hovering near the value area high, consolidating in what appears to be a corrective formation. The bullish market structure is still intact, as there has not yet been a decisive breakdown below major support. The correction is forming above the daily support and resistance (SR) level, a key zone with high time frame significance.
This support level is reinforced by the 0.618 Fibonacci retracement, adding a layer of technical confluence to this potential bottoming region. If price maintains this level, it creates a high-probability setup for a bounce toward the previous swing high, which remains a logical upside target.
However, if ZBCN loses this daily level—particularly on an influx of volume—it would mark a structural failure and increase the probability of a deeper corrective move. The next logical downside target would be the point of control, where prior accumulation occurred and where strong historical volume resides. A move toward this area would not invalidate the larger uptrend entirely, but it would shift momentum into a deeper retracement phase.
Maintaining structure above the current support is crucial for bullish continuation. As of now, the uptrend remains valid, and the current movement can be considered a healthy correction as long as support holds. A successful retest of this region could trigger renewed interest from buyers and ignite a move back toward the range high.
If the level fails, however, traders should prepare for a drop toward lower support zones and reassess momentum accordingly. The overall sentiment remains bullish, but that bias is contingent on structure being respected at this stage.
What to Expect in the Coming Price Action
A hold above the daily SR and Fibonacci support could lead to a new rally toward the swing high. If the level fails, watch for a corrective move toward the point of control.
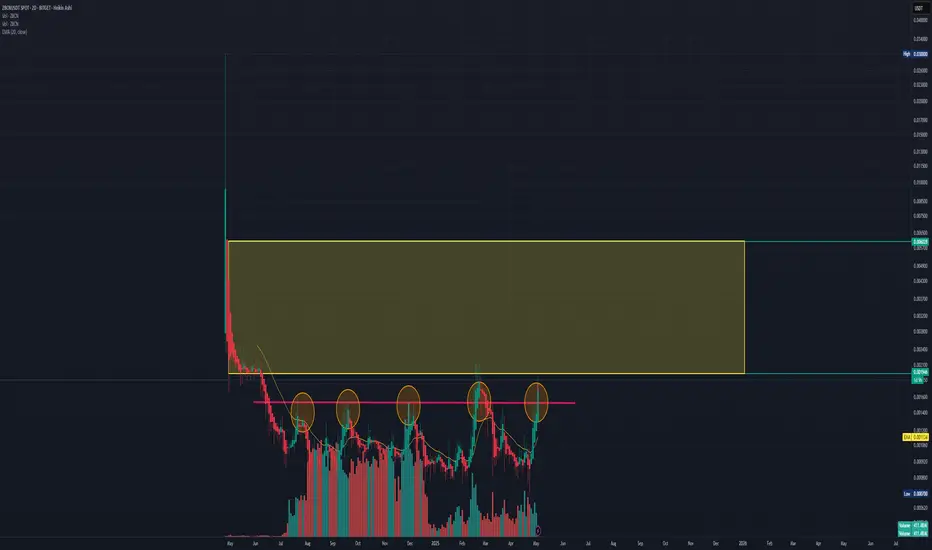
Zebec Retests Range High as Point of Control Caps BreakoukZBCN is trading above its long-term accumulation range, but faces key resistance at the point of control. A volume-backed reclaim could trigger a breakout toward new all-time highs.
Zebec (ZBCN) has pushed above its multi-month accumulation range and is now attempting to solidify a bullish retest of the range high. While this is typically a positive signal for continuation, ZBCN is facing immediate resistance from the point of control (POC) — the region of highest traded volume within the current structure. Until price breaks and reclaims this level, a full bullish breakout remains on hold.
Key Technical Points:
-Trading above long-term accumulation range – Breakout confirmed, but must hold to remain valid
- Point of control acting as resistance – Volume-heavy region currently capping upward momentum
-Retest of range high is critical – Needed to avoid swing failure and confirm bullish structure
From a technical standpoint, the range high — which served as resistance during the accumulation phase — now needs to be flipped into support. A successful retest and reclaim of this level will confirm it as a new demand zone. This would provide the structural foundation for a stronger move upward, especially if it is followed by a breakout through the point of control.
However, if ZBCN fails to reclaim the POC and volume continues to decline, there is a risk of a swing failure pattern (SFP) forming at the range high. This could lead to a temporary breakdown before another attempt to move higher. A sweep of the recent swing low may occur as part of this rotation, but if the market structure holds and buyers return, this could also serve as a bottoming formation and setup for renewed upside momentum.
The broader outlook remains bullish, provided price can stay above the previous accumulation range. But the next key step in the trend progression is a decisive break and hold above the POC with strong volume. If this occurs, it would unlock the potential for a move to new all-time highs, as there is little historical resistance above the current zone.
ZBCN needs to confirm its bullish structure by reclaiming the point of control with volume support. If it can successfully retest the range high and avoid a swing failure, the stage is set for continuation toward price discovery. Until then, short-term volatility around the range high and swing low levels is expected.
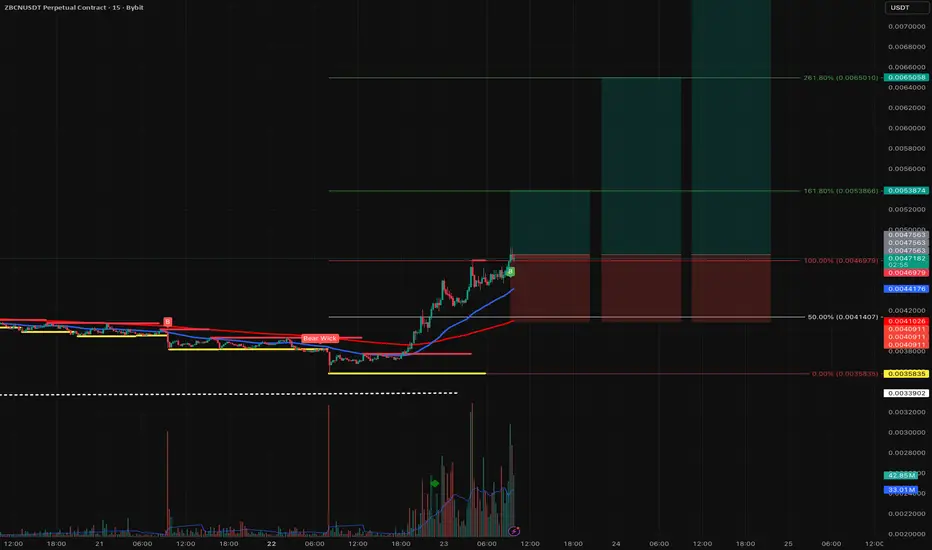
ZBCN/USDT | Breakout from Downtrend Channel | 360%+ Potential !!ZBCN has broken out of a clean falling channel on the 4H timeframe. This setup resembles the earlier rally in May that delivered over 350% upside. We may be setting up for another explosive move, contingent on a successful retest.
Trade Setup:
Entry (on retest): 0.002901 – 0.003021
Stop Loss: 0.00243 (below channel low)
Targets:
0.00375
0.00510
0.00685
Long-term target: 0.01137
Total potential upside: ~360%
Structure Analysis:
Price is now out of the descending channel
Previous move from similar breakout yielded ~357%
RSI climbing with volume surge — momentum shift evident
Watching BTC for macro support
This could be a game-changing entry for medium to long-term holders if the retest holds.
DYOR | Not financial advice

ZBCN Technical Analysis – Breakout From AccumulationZBCN has shown impressive strength recently, following a textbook breakout from an extended accumulation phase. This kind of setup is well-known among technical traders: a period of sideways, range-bound price action often leads to an explosive move once resistance is broken — and that’s exactly what ZBCN has delivered.
The breakout has triggered a significant rally, and price action is now trending firmly upwards. From a structural standpoint, this is a clear shift from consolidation to expansion, which typically attracts momentum buyers and short-term traders aiming to ride the wave higher.
Currently, ZBCN is trading with strong bullish momentum, and the technicals suggest there is room for further upside. The immediate bullish target lies at the Fibonacci extension level of 0.011 satoshi, which marks a potential gain of approximately 258% from the earlier consolidation range. This Fibonacci level aligns with the nature of impulsive rallies that often follow accumulation breakouts.
However, one key level to watch remains the 0.032 satoshi zone. This level has not yet been retested following the breakout and stands as a critical structural area. A clean retest of this zone would provide confirmation of the breakout’s strength and likely act as a launchpad for the next leg higher.
In summary, ZBCN is currently exhibiting very bullish price action following its transition out of accumulation. If the rally continues without a retest, traders should look toward Fibonacci extension levels as potential short-term targets. If a pullback occurs, the 0.032 satoshi level is the most important zone to hold in order to maintain the breakout thesis.
As long as current momentum remains intact, the path of least resistance appears to be to the upside.

Can we be optimistic that this will come true?Perhaps this is a cup and handle pattern, and if that's the case, it could push the price up to around 0.004 .
Give me some energy !!
✨We spend hours finding potential opportunities and writing useful ideas, we would be happy if you support us.
Best regards CobraVanguard.💚
_ _ _ _ __ _ _ _ _ _ _ _ _ _ _ _ _ _ _ _ _ _ _ _ _ _ _ _ _ _ _ _
✅Thank you, and for more ideas, hit ❤️Like❤️ and 🌟Follow🌟!
⚠️Things can change...
The markets are always changing and even with all these signals, the market changes tend to be strong and fast!!

ZBCNUSDT coin Go to down againZBCN coin going to down againe..get entry short position.don't miss this chance.
Target
0.0014500
0.0010900

$ZBCN #ZBCN ZBCN ZBCNUSDT #LONG #BitgetLong base #breakout on volume fueld by news of partnerships, certifications and buybackscould be the catalyst for an explosive move. A strong following and socials backing is an added boost.
ZBCN - Exiting from stage 1!
Price Action Overview
The price has broken above previous resistance levels with strong bullish momentum, accompanied by a spike in volume.
The breakout occurred after a long period of consolidation, where the price was moving sideways with relatively low volatility.
The RSI is above 74, indicating the asset is currently in an overbought zone, which could lead to either a pullback or further continuation if momentum remains strong.
The moving averages (4EMA) are trending upwards, confirming bullish momentum.
Key Levels & Possible Targets
Support Levels:
0.00133 USDT → Previous resistance now acting as support.
0.00157 USDT → Another key level where price might find support if it pulls back.
Resistance & Potential Targets:
0.00177 USDT (Current level) → Price is testing this area, a strong close above could lead to further upside.
0.00200 USDT → Psychological resistance, a key level to watch.
0.00250 USDT → If momentum continues, this could be the next target.
Possible Scenarios
Bullish Continuation 🚀
If price holds above 0.00157 and consolidates, another breakout could push it towards 0.0020 – 0.0025 USDT.
Strong volume confirms the uptrend.
Pullback Before Further Upside 🔄
Since RSI is overbought, a short-term retracement to 0.00157 – 0.00133 before resuming the uptrend is possible.
A retest of previous resistance turned support would be healthy.
Breakdown & Rejection ❌
If price fails to hold support at 0.00133, it could drop back to previous consolidation levels.
Conclusion
The trend is currently bullish, but a short-term retracement is possible due to overbought RSI. If the price holds above key support levels, the next targets would be 0.0020 – 0.0025 USDT.
