None of you understand what ZEC isThis is not some random coin. Zcash is the continuation of Satoshi's original Bitcoin design. You are witnessing the immolation of Bitcoin, and replacement with Zcash. Remember this moment. It will be talked about for decades to come
Trade ideas
Call me crazy... but... ZEC Still has momentum?!Alright, I know what you're thinking. ZEC has already seen a significant pump. But looking at the 4-hour chart, I can't help but see the potential for even more upside run here.
We appear to be in the midst of a classic Elliott Wave structure. I think we completed a strong bullish wave (3) and have just finished what I believe is an ABC correction for Wave (4). Price found strong support around the 50 period simple moving average, and the OBV is also showing strength, holding its trendline even during the correction. Whenever it touches that OBV trend, it bounces up in the past.
Long Entry: Current levels seems holding itself pretty well on the 50-peroid SMMA. Very good R:R setup.
Target: $950
A decisive break and close below the 50 SMMA and the Wave (4) will invalidate the whole wave count.
Good Luck!

ZEC/USDT Major trend. 2 halving 17 11 2024. 17/160,18Major trend. Large time frame for clarity. Old exchange Poloniex (low liquidity) due to long trading history to show everything clearly. As you can see with each cycle the highs are decreasing....
Cycles of life and death . This cryptocurrency is going into its third cycle. It will most likely be the last because of its anonymity. In a decentralized super centralized world, nothing can be anonymous! Am I wrong? States don't need anything anonymous. The demands of market regulation will “strangle” anything anonymous. But, this is later, and before the halving, which will happen on 17 11 2024 with a high probability they will pump up to 160.18$, and maybe even higher, if the card falls.
Saving "dirty money" when CBDC is introduced by banks . Some people think that when CBDC of central banks is introduced, through anonymous coins like ZEC, HMR and so on, big capital will "save" their shadow money. A fairy tale for school children. I have little faith in it. I think such money has been saved long ago. Although this story to create a news background as a reason to pump has a place ....
It's worth noting that BCH and BTC will first halve in April 2024.
News from Satoshi . By the way, "rumor has it" that closer to the summer of 2024, according to the plot of our crypto movie called good/bad, a new “Satoshi Nakamoto”. Will be announced, who will plunge everyone into “uncertainty of actions/consequences” in the market. Rumors also claim it will be the universally hated villain, Craig Wright). Do you think the role will go to another villain, Roger Ver? Or have these two characters already played out and the role will go to someone else? Or maybe the plot itself will be canceled? Perhaps. Time will tell, the manipulators can come up with anything, that's not the point.
Immunity from news nonsense. The main thing is to treat such "crypto stories", even if there is a real imitation of provability, with the utmost equanimity. Remember, no matter what is going on, it is all a hoax to capitalize on the direction of the trend. The news background that is created to accompany price movement.
Line chart.
Secondary trend. Timeframe 3 days

Emotional Control 101 **Emotional Control 101:
Hello Traders 🐺
How to Stop Fear, Greed, and Impulse from Destroying Your Trades**
Welcome back to another post.
In this article, we will dive deep into one of the most overlooked yet defining skills in trading: Emotional Control.
This is not just a topic — it is the psychological foundation that decides whether you rise as a trader or fall like the rest.
Let’s break it down step-by-step.
1) What is Emotional Control in Trading?
Emotional Control is the ability to stay balanced, objective, and disciplined regardless of what the market is doing.
It is the skill of thinking clearly when everything inside you wants to react impulsively.
Every trader brings emotions into the chart:
fear, greed, impatience, overconfidence, revenge, hope.
These emotions influence your decision-making process more than any indicator or strategy ever could.
Your emotional state determines:
when you enter,
when you exit,
how you manage losses,
how you react to wins,
and how consistent you can remain during uncertainty.
A controlled mind protects you.
An uncontrolled mind destroys you.
Both are fully in your hands.
2) The Hidden Enemies: Fear, Greed, Impulse
Let’s break down the 3 psychological forces that ruin most traders:
Fear
Fear makes you exit early, skip valid setups, hesitate, doubt your edge, and anticipate danger even when your analysis is correct.
Greed
Greed makes you chase price, hold too long, ignore your plan, and believe that every pump will continue forever.
Impulse
Impulse is the silent killer.
It pushes you into trades without confirmation, without analysis, without structure — simply because your brain demands a dopamine hit.
These emotional forces show up fast, and if you do not control them, they will take over.
3) Why Emotional Control Matters More Than Strategy
You can have the best strategy in the world, but if you cannot control your reactions?
You will fail.
Without emotional structure, trading becomes gambling.
You become reactive, not strategic.
You chase, you force, you hope — instead of plan, execute, and review.
A trader with average strategy but strong emotional control will always outperform a trader with a perfect system but no discipline.
Emotional mastery is the filter that protects your capital and aligns you with high-quality setups ONLY.
4) How to Build Emotional Control (Step by Step)
Just because it is difficult does not mean it is impossible.
Here is the practical framework:
Step 1 — Build Discipline Through Consistency
Create a clear trading plan.
Define your edge.
Commit to following it whether the market is pumping, dumping, or consolidating.
Consistency creates internal strength.
Strength creates emotional stability.
Step 2 — Develop Emotional Awareness
Become conscious of how you react during trades.
Ask yourself:
When do I feel fear?
When do I feel FOMO?
When do I feel reckless confidence?
Which emotions pull me away from my edge?
Awareness is the first step to control.
Step 3 — Journal Everything
You cannot control what you cannot see.
Log:
every loss,
every win,
every emotional trigger,
every setup you forced,
and every setup you skipped.
Be brutally honest.
Your journal is your mirror, not your trophy case.
Patterns will appear.
Identify them.
Correct them.
Step 4 — Build Trust in Your System
You must trust two things:
your strategy,
yourself.
Backtest.
Forward test.
Refine your criteria.
The more proof you collect, the less emotions will dominate your decisions.
Confidence must come from data, not hope.
Step 5 — Master Patience
The most important psychological skill.
Only take A++ setups.
The ones with multiple confluences lining up — not the setups that “feel right,” but the ones that are right.
Patience protects you from impulsive trades.
Patience separates traders from gamblers.
5) How Your Daily Life Affects Your Emotional Control in Trading
Your psychology outside the chart becomes your psychology inside the chart.
If your life is chaotic, emotional, stressed, or unstable —
your trading will mirror it.
A breakup, an argument, a bad day at work, fatigue, stress…
All of these push the mind to seek dopamine.
And where does it run for that dopamine?
The charts.
But emotional trading is destructive.
It leads to revenge trades, overleveraging, forcing setups, and chasing losses.
If you cannot regulate your emotions in daily life,
you cannot expect to regulate them in a high-stress environment like the market.
Control your life → control your trades.
KEY POINTS
1) What is Emotional Control:
Your ability to remain balanced under pressure. Master the mind → master the trade.
2) Hidden Enemies:
Fear, greed, and impulse destroy discipline and clarity.
3) Why It Matters:
Without emotional control, trading becomes gambling. With it, you gain structure, patience, and objectivity.
4) How to Build It:
Consistency, emotional awareness, journaling, trust in your system, and patience.
5) Daily Life Impact:
Your external emotions directly influence your performance in the market.
Strengthen your mind outside → strengthen your mindset inside.
Thank you all for reading —
I hope this post brings clarity and value to your trading journey.
Emotional control is only one of the 3 psychological pillars that lead to trading success.
If you would like a deep dive into the remaining two keys, let me know —
I’d be glad to share more with the community.

#ZECUSDT Privacy Narrative 2025-2026!ZEC is a privacy coin, and before we jump into numbers, you should ask yourself:
Why are privacy coins leading this cycle?
If you haven’t asked this yet, then it’s time to dive deeper —
because the narrative itself is part of the pump.
🔥 Main Question
Will ZEC hold momentum and continue bullish,
Or will $800 be the end of this wave?
Short Answer:
I see ZEC reaching $1,500 before or by Feb 2025.
We already caught it in the $4XX range days ago after making this TA:
🧭 Technical Foundation
This ZEC read is based on:
Elliott Wave (EW)
Gann Timing
Fibonacci Map
Harmonic structure confirmations
ZEC is currently at a crossroads, and the next monthly close will decide its fate.
🔑 What ZEC Needs for $1,500
1. Weekly Hold for now to keep things up:
$480 must hold weekly
No monthly close below this range
2. Bullish Monthly Close:
$560–$630 monthly close → excellent strength
Confirms buyers defending the trend
3. Breakout Key:
$800 → breakout
Opens runway to $1,200 → $1,500
New ATH window
Monthly close = the key factor for ZEC’s entire roadmap.
💼 Trade Plan (My Setup)
My Buy Levels:
$359.25
$419.13
$479.00 → now in profit
Stop-Loss:
$250
A monthly close below $ 230 invalidates the structure.
Risk Allocation:
3–5% max investment
Even with a 2× target, the risk remains controlled
→ You risk $1 to aim for $2+
Duration:
180+ days
Confidence Level: Medium
📌 Quick Recap
Key support: $480 weekly
Monthly range to watch: $560–$630
Breakout: $800 → $1,200 → $1,500
❌ Invalidation: Monthly below $260
🧩 Risk: 3–5%
⏱ Duration: 6 months+
⚓ Renzo Tip
“Privacy coins rise when the crowd starts whispering, smart captains listen before the storm arrives.”
Do your own research, as always.
Prayer
May Allah protect our trades from hidden risks, guide us toward clarity,
and give us wisdom to manage both fear and greed in every cycle.

ZECUSDT - Testing Support For Potential Relief BouncePrice is reacting to a strong demand zone after forming an M-top pattern on the higher timeframe. Watching for a short-term relief move toward the 0.5–0.618 retracement levels (around 470–490) before deciding whether this becomes a full reversal or just a retest.
If the 450 level holds, continuation to 520–540 is possible. If 450 breaks cleanly, I’ll look for a deeper long setup near 399–371.
Stop loss for the short-term long is below 450.

ZCASH – Simple Bearish Engulfing | It’s Not Rocket Science💡 Idea:
A clean bearish engulfing pattern has formed after a strong uptrend — classic technical setup showing signs of short-term exhaustion.
No fancy indicators, no overcomplication — just price action and patience.
Markets reward those who can repeat a simple process consistently.
Spot a setup → Wait for confirmation → Manage risk → Repeat.
That’s it.
It’s not rocket science — it’s discipline. 💯
Key Levels:
Resistance: 669 – 684
Support: 512 – 529
Breakdown Target Zone: 450 – 480
Let’s see if ZCASH respects the structure.
#ZCASH #Crypto #PriceAction #BearishEngulfing #TradingPsychology #Discipline

ZEC - BEARISH REVERSAL AWAITED! CRYPTOCAP:ZEC - Bearish setup 🟥
Double top structure likely, anticipating before the others a bearish reversal HTF! 📉
Keep an high on the HH.
#ZEC #TRADING

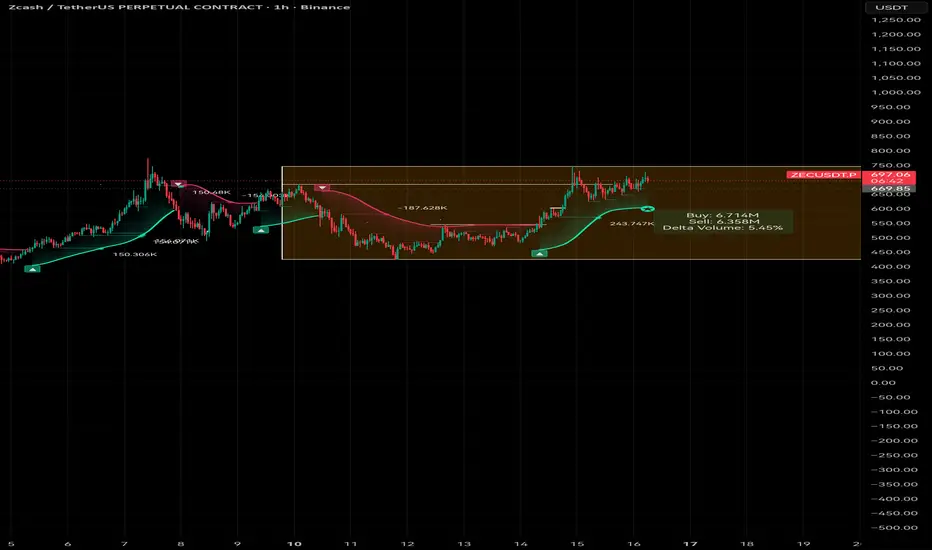
$ZEC Weekly candleThe chart shows ZECUSDT trading inside a clearly marked weekly candle range highlighted by the large box. Price has spent an extended period consolidating within this zone after a major drop, and the recent move indicates buyers are gradually gaining strength, supported by a positive delta volume reading. The market is currently pushing toward the upper boundary of the weekly range, showing signs of an emerging short-term bullish structure. As long as price remains above the mid-range of the box, the bias stays positive. A logical take-profit level sits near the upper range resistance around 740–760, where previous reactions occurred. A reasonable stop-loss would be below the lower boundary of the weekly box near 540–560, which marks the key support that defended the market during the consolidation. If the breakout holds above the weekly range, the next trend is likely to continue upward with momentum, but rejection at the top would pull the market back into sideways consolidation.
ZioCash top may be in- had a spectacular run
- showing signs of heavy exhaustion on the 5D timeframe with a clear bearish divergence present
- other signs of distribution
- targets sub 500 likely

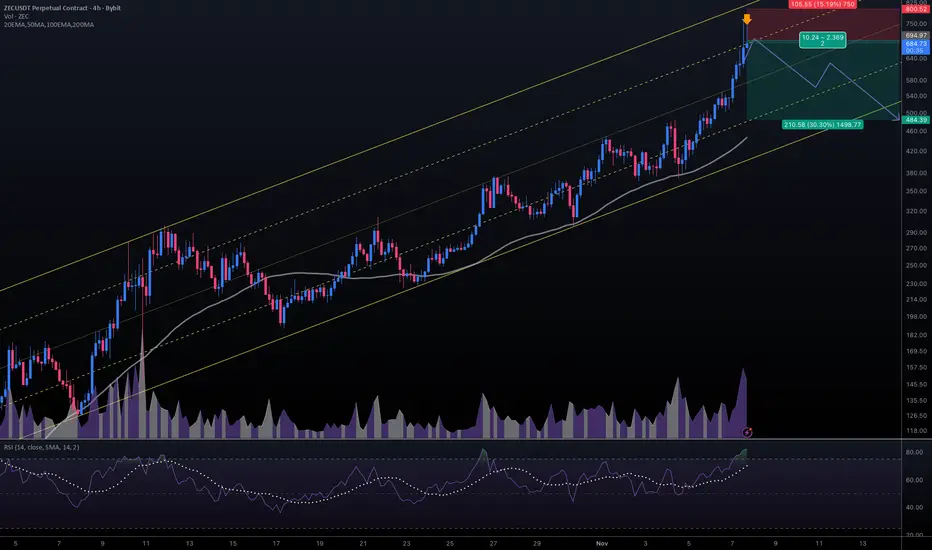
#ZECUSDT #4h (ByBit) Ascending channel on resistance [SHORT]Zcash just printed a shooting star and entered overbought territory again.
It seems likely to finally retrace down towards 50MA support, short-term.
⚡️⚡️ #ZEC/USDT ⚡️⚡️
Exchanges: ByBit USDT
Signal Type: Regular (Short)
Leverage: Isolated (3.0X)
Amount: 4.4%
Current Price:
684.73
Entry Targets:
1) 694.97
Take-Profit Targets:
1) 484.39
Stop Targets:
1) 800.52
Published By: @Zblaba
CRYPTOCAP:ZEC BYBIT:ZECUSDT.P #4h #Privacy #ZK z.cash
Risk/Reward= 1:2.0
Expected Profit= +90.9%
Possible Loss= -45.6%
Estimated Gaintime= 1 week

ZECUSDT.P - November 15, 2025Price is in a strong short-term uptrend, but momentum is stalling just beneath the immediate resistance zones where sellers has previously stepped in. A clean break and hold above this area could open the path toward the next resistance around 720–740, while rejection here may trigger a pullback toward the 600–580 support zone where buyers last showed strength.

ZEC USDT LONG SINAL---
📢 Signal Alert
🔹 Pair: ZEC / USDT
📈Trade Type: Long
💰Entry Zone: 459.32 - 439.82
🎯 Take-Profit Targets (Partial Management):
▫️TP1 = 496.50
▫️TP2 = 522.43
▫️TP3 = 547.27
▫️TP4 = 576.44
▫️TP5 = 599.12
▫️TP6 = 665.00
🛑 Stop-Loss: 421.98
📊Timeframe: 15m
⚖️Risk/Reward Ratio: 3.25
📌Suggested Leverage: 5x - 3x
⚠️ Capital management is mandatory.
💬Please review the chart before entering the trade.
---
🧠 Technical Overview:
ZEC is trading within a wide support zone between 474.22 and 446.82.The multiple take-profit targets suggest a comprehensive bullish outlook with significant upside potential. The price structure indicates potential for a substantial upward movement if the support zone holds.
The extended target range and relatively wide entry zone allow for strategic position scaling and systematic profit-taking at each resistance level.
---
⚙️ Trade Management Tips:
· Scale into position within the wide entry zone (474.22 - 446.82)
· Take partial profits at each target level to secure gains
· Move stop-loss to breakeven after TP1 or TP2 is reached
· Trail stop-loss aggressively as price approaches higher targets
· Consider the extended nature of TP5 and TP6 as longer-term objectives
· Close position immediately if price breaks below 421.98 support
---
⚠️ Disclaimer:
This signal is for educational purposes only and not financial advice.
Always perform your own analysis and apply strict risk management.
---
Note: The leverage suggestion has been adjusted to 5x - 3x based on your input, which is more conservative than previous signals.

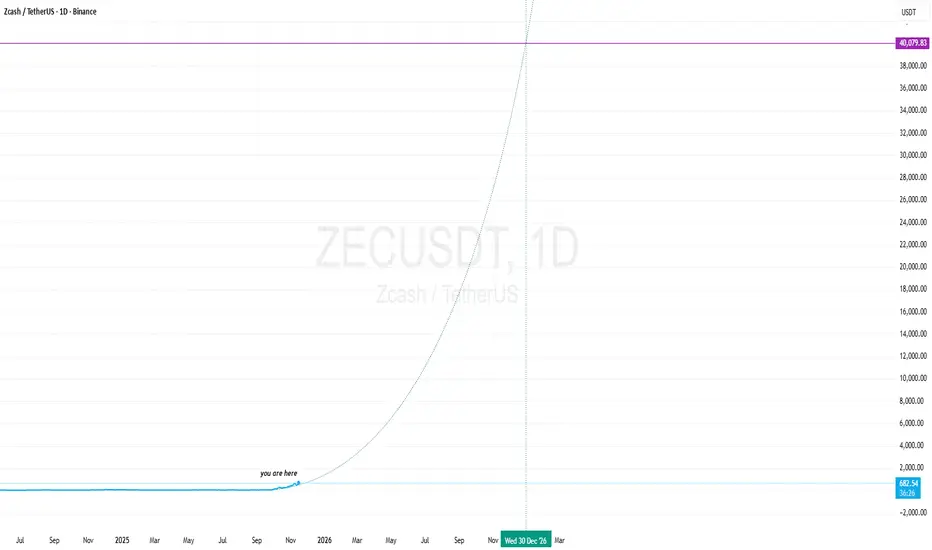
ZECCRYPTOCAP:ZEC has formed a clean inverse head and shoulders pattern, and the measured target sits at $1000. The structure looks strong and it’s very possible this plays out in the short term if momentum continues to build.

$ZEC/USDT is heating up again! $ZEC/USDT is heating up again! 🔥 After an explosive rally from $308 to $580, bulls are defending the $490–$450 support zone with strength. If this level continues to hold, momentum could push ZEC toward $720–$900 next.
#ZEC #Zcash #Crypto #Altseason #trump NASDAQ:AIA NYSE:MMT #trb #CryptoMarket

Zcash woke up but don’t rush to buy.Once again, the market is chasing the “privacy narrative”, looking for the next 1000x coin.
But to me, it feels like just another storyline — the same pattern we’ve seen dozens of times:
AI, L2s, GameFi, RWA… now Privacy.
Every time it’s the same: hype → belief → pump → dump.
Yes, privacy matters.
But the market doesn’t pay for ideas it pays for liquidity, activity, and community.
ZEC can still make a move if big wallets start pushing it,
but fundamentally, this is just another stage of the cycle:
📉 capitulation → 🗣 narrative → 📈 pump → 😶 silence.
Technically, the next real buy zone sits around $200–220.
Buying high now makes no sense patience will pay off.
🧊 Wait for the hype to fade then act.

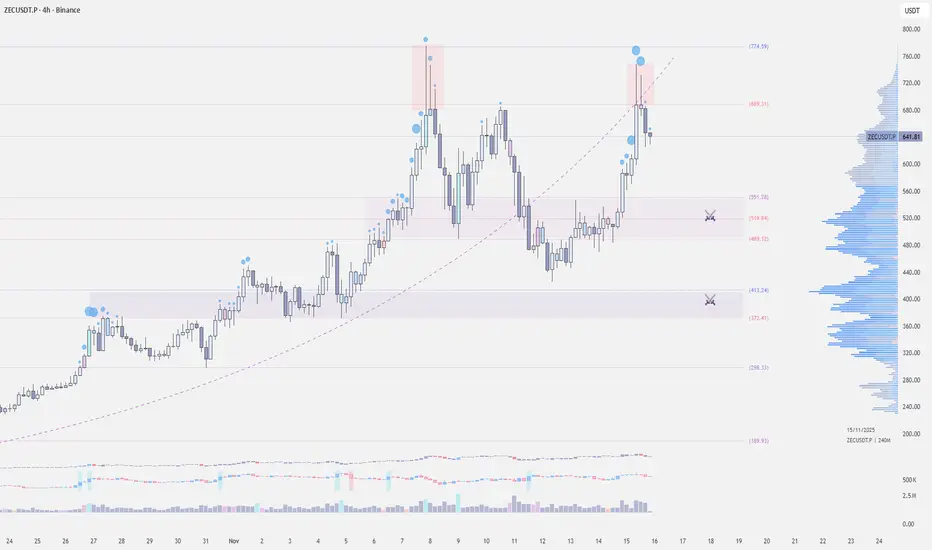
$ZEC — Momentum Cools Off Zcash remains one of the standout movers in the market. This rally looks less like pure speculation and more like a narrative shift — privacy is back in focus, and Zcash’s optional privacy model puts it in a unique spot. Institutional flows and real tech upgrades are supporting the move, but it’s still a highly volatile asset. If shielded-transaction adoption slows or regulatory pressure picks up, momentum can fade quickly.
Over the past 24 hours, BINANCE:ZECUSDT trading volume surged nearly 98% while the broader market bled. Price is hovering around $630 after a strong rejection, retesting ATH resistance and a major distribution zone.
This is not a fresh entry zone. Risk-to-reward here is extremely dangerous as momentum cools off. The breakdown signals clear exhaustion and opens the path for a sharp correction toward the $550–$520 region. If that area fails to hold, the next major support sits at $412–$370.
Privacy is Pricy Again — How Zcash Got Back in the GameA significant shift is recently observed in the cryptocurrency space, indicating a resurgence of interest in privacy. The sharp rise of Zcash (ZEC) — over 46% in the week following Galaxy Research's analysis — is a clear example of this trend, reflecting the market's demand for untraceable funds.
Zcash, after years on the sidelines, has returned to the forefront, confirming that the fundamental cypherpunk ideals of privacy hold high value in the modern financial system.
1. Technological Breakthroughs and Zcash’s Fundamental Growth
The Zcash rally is driven not only by speculation but also by major improvements that have made privacy both more accessible and more effective:
Removing Barriers (Zashi & NEAR Intents): The use of zk-SNARKs (zero-knowledge proofs) has become more user-friendly. Enhanced user experience (UX) in new wallets (like Zashi) and integration with cross-chain mechanisms like NEAR Intents have removed the technical friction associated with "shielding" transactions.
Strengthening Anonymity: The most crucial network metric for Zcash is the increase of shielded coins in the Orchard pool to over 30% of the total supply. The more coins are "hidden," the larger the anonymity set becomes, which mathematically increases the difficulty of tracing transactions.
Technological Edge: Zcash, unlike some competitors, offers quantum-resistant cryptography and a stronger privacy mechanism via zk-SNARKs, which allows transaction validation without revealing the amount, sender, or receiver.
2. Zcash as a Counter-Trend to Transparency
The sharp price increase of ZEC after years of stagnation reflects a broader market narrative:
Reaction to Institutionalization: Against the backdrop of Bitcoin's growing transparency and institutionalization (ETFs, centralized custodians), Zcash is positioning itself as “encrypted Bitcoin”—an asset that refocuses attention on the decentralized and private nature of crypto assets.
Regulatory Balance: Zcash utilizes optional privacy, which, according to analysts, may provide the project with greater regulatory resilience compared to coins where privacy is mandatory by default.
Repricing Privacy: The market has demonstrated that the demand for confidentiality has not disappeared. The Zcash rally has forced investors to re-evaluate all privacy-focused projects, proving that, amid increasing online surveillance, the ability to transact privately has once again become a highly valuable feature.
Summary: Zcash is back in the game, bolstered by strong technological improvements that have made its privacy accessible and effective. The sustained nature of this growth will depend on whether the project can convert this speculative momentum into stable growth in user and network activity.

Zcash(ZEC/USDT) | Don’t Get Caught in the Whales’ Trap🧠 ZEC/USDT – Smart Money Trap Before the Drop?
Zcash just swept liquidity below a key short-term low 👀 — now reacting from a demand zone, but volume confirms weak bullish intent.
Expect a liquidity grab + distribution phase before price dives toward the $300–$350 range, aligning with higher-timeframe imbalance fills and unmitigated demand below.
Smart Money might be engineering one last bull trap before the real markdown begins.
📉 Watch for rejection from the $620–$650 supply zone to confirm the move!
#ZECUSDT #Zcash #CryptoAnalysis #PriceAction #SmartMoneyConcepts #LiquidityGrab #BearishSetup #CryptoTraders #TradingView #Fibonacci #SwingTrade #MarketStructureBreak #Wyckoff #SMC
💬 What’s your bias — bull trap or reversal? Drop your thoughts below 👇

ZECUSDT Breakout Confirmed: Trendline Broken and 29% Upside AheaZECUSDT is finally breaking out of a multi-week downtrend — the diagonal trendline is broken, volume is ticking up, and the structure signals a potential phase shift.
Price is holding strongly above the broken trendline, forming a base for a possible rally toward 685 → 775 USDT .
Why this moment matters:
Clear breakout of the descending trendline
Price is consolidating above — early trend reversal confirmation
W-pattern structure forming
Volume increasing at the local bottom — buyers stepping in
Entry Level:
Long on a retest of 545–555 USDT
Ideally after a higher-low confirmation.
Stop-Loss:
503 USDT
(Just below liquidity — invalidation point.)
Take-Profit Targets:
685 USDT — first reaction zone
735 USDT — liquidity cluster / previous supply
775 USDT — final major resistance
Potential upside: +24% to +29% with controlled risk.
Technical Breakdown:
Trendline breakout confirms CHoCH
Consolidation above breakout = bullish preparation
Early signs of accumulation in volume
Classic setup: support → breakout → retest → impulse
What to watch next:
Holding the 545–555 zone
Higher lows — bullish continuation
Reaction around 685 — possible short squeeze
Volume strength on breakout attempts

$ZEC/USDT bounced after retesting the ascending channel? $ZEC/USDT bounced after retesting the ascending channel and the trend looks strong. Buyers protected the $490 and $450 levels, and now the price is trading around $650 shows momentum is turning up again. If this continues, ZEC could move toward the $720 to $900 range.

ZEC - PRICE UPDATE:CRYPTOCAP:ZEC - Price Analysis:
The daily uptrend remains strong and ongoing, but we're seeing some warning signs:
⚠️ Daily bearish divergence on RSI
⚠️ Overbought territory reached
Bulls still appear in control within the H4 uptrend channel, though it's difficult to determine if we've reached a local top just yet.
Price could consolidate between 700− 500 (yellow zone) before we see the next significant move.
Short term play:
Below $ 680 would likely turn bearish, with the following support levels to watch:
🎯 $ 560
🎯 $ 535
🎯 $500
Globally, above 400 - 410$ = bullish on the weeekly basis.
Remember:
No breakout of the high = No trend continuation.
