ZENUSDT — Make or Break: Triple Bottom Formation or Breakdown?
🔎 Overview
Horizen (ZEN) against USDT on the weekly timeframe is now trading at a critical juncture. After a long decline from its all-time high near $169 in 2021, ZEN is retesting the historical support zone at $5.06–7.00. This area has acted as a strong demand zone for years, making it the ultim
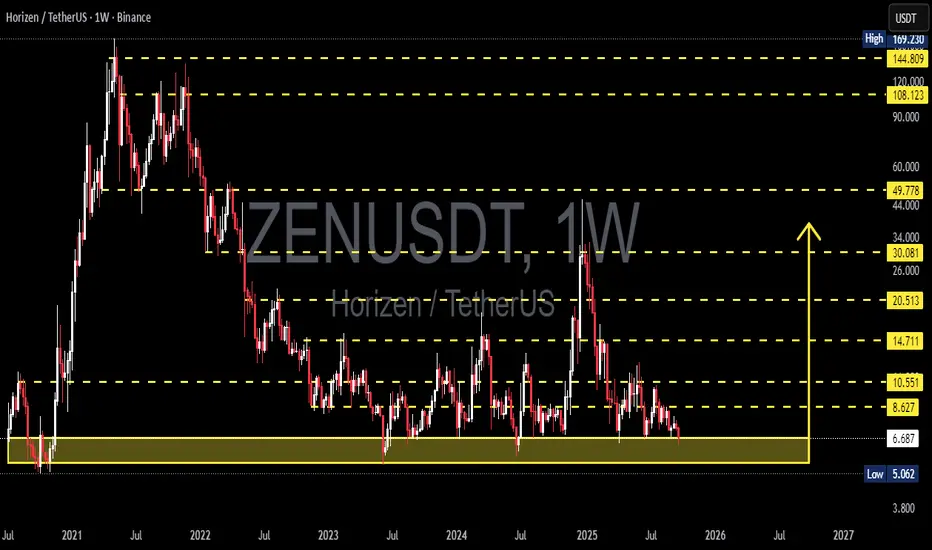
Zen purchase may be considered for possible altcoin season.Uncertainty persists following the Fed meeting. I can't yet predict how the market will react to the three interest rate cuts (in the short to medium term). However, if money inflows into the market and others.d rise, it would be beneficial to review the altcoins that have broken through. One of the

ZENUSDT at the Crossroads: Accumulation or Final Breakdown?📊 Chart Overview
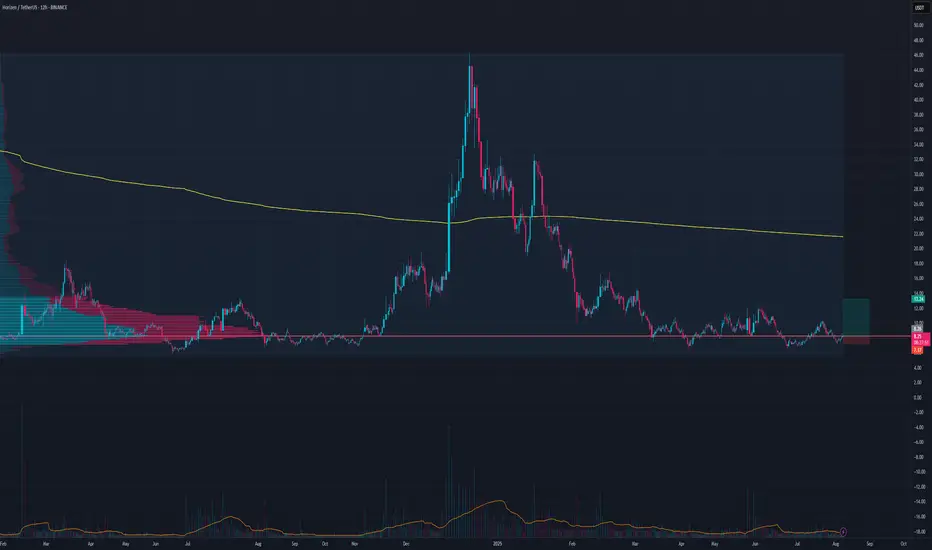
The ZEN/USDT (Horizen) pair on the 4D timeframe is currently sitting inside a critical accumulation zone between 5.40 – 9.24 USDT (highlighted in yellow). This area has acted as a demand zone for more than 2 years, with multiple successful retests.
The price is now trading around

ZEN/USDT NEW increase view Zen/usdt has a pre increase view - should hold $7 for further increase
waiting to see if there are new confirmations on the way.

I'm bullish alt coinsThis is just one setup but I'm bullish on this sector
TP1 13.24
TP2 21
TP3 29
TP4 65
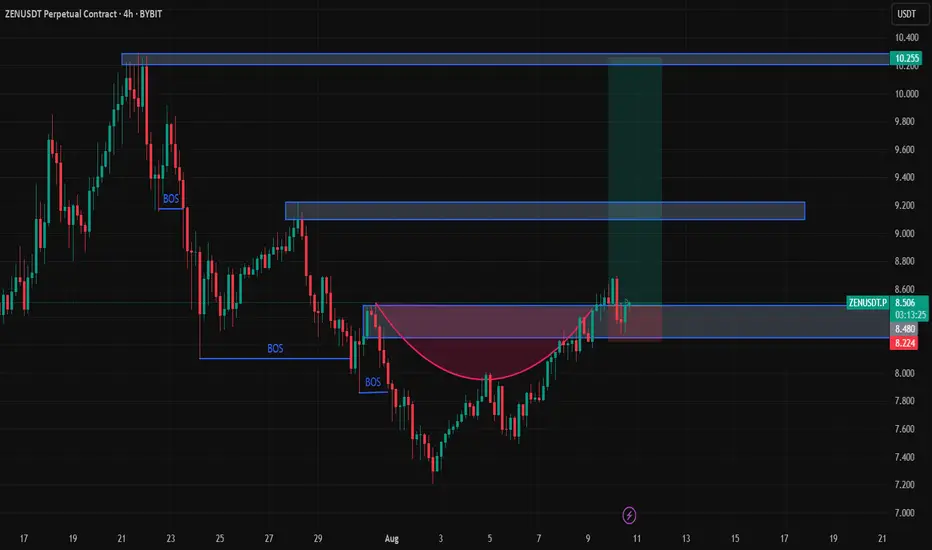
ZEN AnalysisZEN has broken the CUP pattern in an upward direction as expected. The price is holding above $8.508, and you can open a long position with a stop loss. We may see a move towards the resistance area.
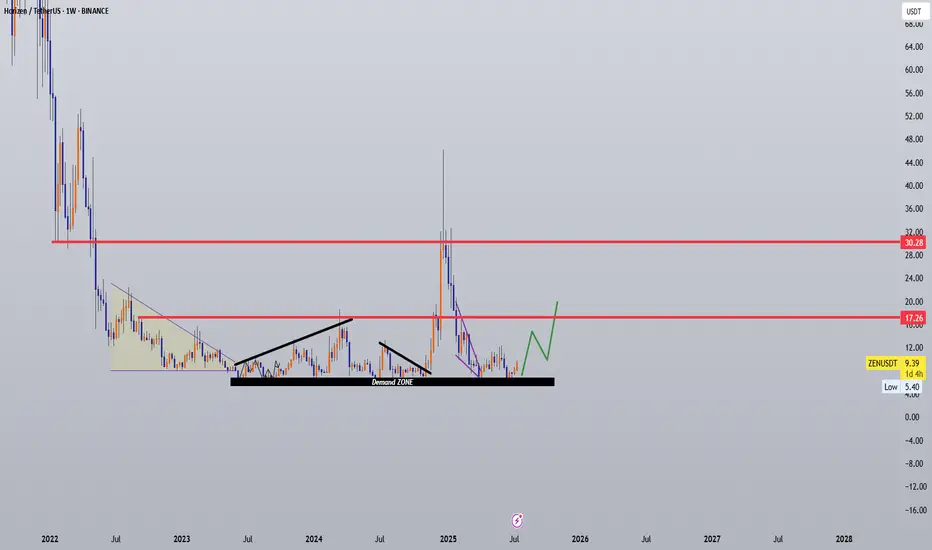
ZENUSDT Accumulation – Undervalued zk L1 with 5x–8x Potential?📌 Coin: ZEN (Horizen)
💰 Buy Levels:
✅ First Entry: $9.30
✅ Second Entry: $7.50
🛑 Panic / SL Level: Weekly close below $6.00
🧠 Fundamental Analysis (FA) – In Short
*️⃣ Sector: Layer 1 / Privacy Infrastructure / Sidechains
*️⃣ Use Case: Horizen is a privacy-preserving, scalable blockchain ecosystem f
ZENUSDT | Triangle Breakout Setup Brewing!#ZEN is currently consolidating in a symmetrical triangle pattern on the 4-hour timeframe, following a strong bearish move. The price action has shifted to a sideways range, signaling a potential trend reversal or continuation setup in the making.
What to Watch:
We’re closely monitoring a bullish

ZEN Approaches Breakout Zone Inside Symmetrical TriangleLSE:ZEN is coiling up inside a symmetrical triangle on the 4H timeframe — a classic setup that often precedes volatility 📊.
Currently, it's testing the upper boundary of the pattern. A strong breakout above this trendline could trigger bullish momentum, while a rejection here might lead to a quick
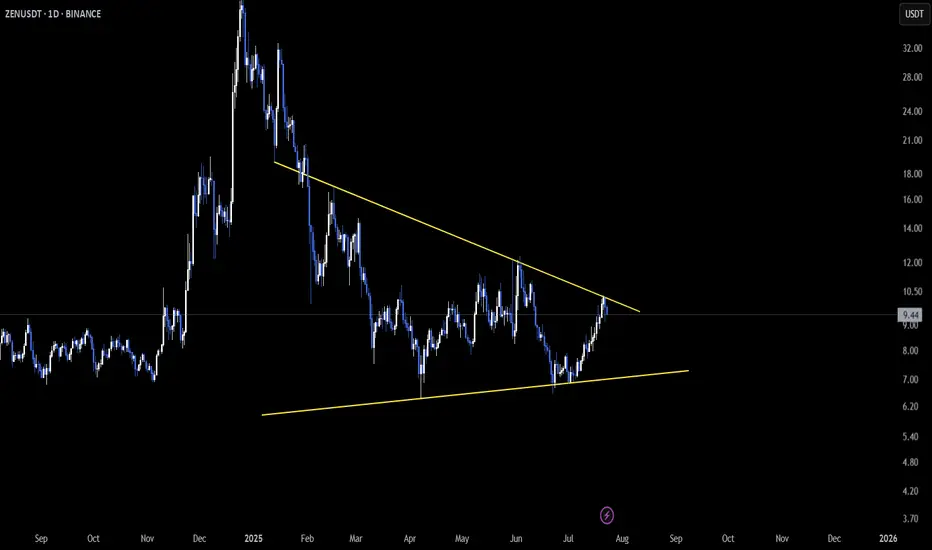
ZENUSDT 1D#ZEN has formed a descending triangle pattern on the daily chart. Consider buying some #ZEN here and near the support level at $8.76, which is roughly aligned with the daily SMA100 — making it a relatively strong support zone. In case of a breakout above the triangle, the targets are:
🎯 $11.31
🎯 $1

See all ideas
Summarizing what the indicators are suggesting.
Oscillators
Neutral
SellBuy
Strong sellStrong buy
Strong sellSellNeutralBuyStrong buy
Oscillators
Neutral
SellBuy
Strong sellStrong buy
Strong sellSellNeutralBuyStrong buy
Summary
Neutral
SellBuy
Strong sellStrong buy
Strong sellSellNeutralBuyStrong buy
Summary
Neutral
SellBuy
Strong sellStrong buy
Strong sellSellNeutralBuyStrong buy
Summary
Neutral
SellBuy
Strong sellStrong buy
Strong sellSellNeutralBuyStrong buy
Moving Averages
Neutral
SellBuy
Strong sellStrong buy
Strong sellSellNeutralBuyStrong buy
Moving Averages
Neutral
SellBuy
Strong sellStrong buy
Strong sellSellNeutralBuyStrong buy
Displays a symbol's price movements over previous years to identify recurring trends.