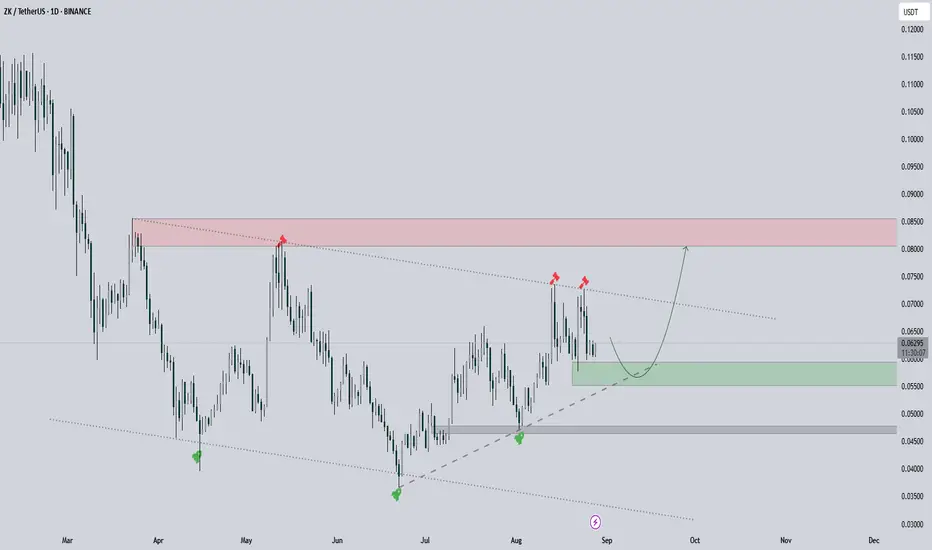
ZKUSDT | Range Defined by Blue and RedOn ZKUSDT, the blue box is acting as demand support while the red box marks firm resistance. For now, the structure is capped within this range.
I’m specifically watching the order flow:
Volume footprint shows clear absorption inside the blue box buyers quietly stacking bids.
CDV is still flat; I

ZK Secondary trend.-82% Wedge. Reversal zones. 01 05 2025Logarithm. Time frame 3 days. Decrease from listing about -82%. For cryptocurrencies of such liquidity and capitalization, this is not the maximum decrease (-90-96%). But sometimes from such values as now (-82-85%), taking into account the news hype during the listing "whales $ 458 million", a rev

ZK Breakout PotentialGiven its recent uptrend and second attempt to break resistance, BINANCE:ZKUSDT shows strong potential to decisively overcome its downtrend and initiate a significant upward wave. A closer look at the chart provides a more detailed perspective.
⛔ Disclaimer: No Guarantee of Profit or Loss
Please
ZKUSDT - your capital will be doubled on thisIf you want to double your capital in a short period, then ZK is the coin to focus on.
-It’s still at the bottom.
-It formed a symmetrical triangle and already broke out, now doing a retest.
-There’s also an inverse head & shoulders pattern in play.
-Currently sitting right on the 25 EMA support

ZKUSDT 1D#ZK has broken above the descending trendline and completed a successful retest on the daily chart. It has also broken above the daily SMA200, which is a strong bullish sign. In case of a successful retest of the SMA200, the potential targets are:
🎯 $0.08057
🎯 $0.09415
🎯 $0.10773
🎯 $0.12707
🎯 $0.15

ZKUSDT Long Setup – Aug 15, 2025
ZKUSDT Long Setup – Aug 15, 2025
Entry: 0.06431
Target: 0.0733 (+15.2%)
Stop: 0.0620 (-3.5%)
R:R: 4.32
I'm currently in this after profiting from the peak formation short and then reversing for the longer term trend.
Why Long?
• Multi-timeframe structure: Higher lows forming on 4H, daily, and w

#ZK/USDT Trendline Break #ZK
The price is moving within an ascending channel on the 1-hour frame, adhering well to it, and is poised to break it strongly upwards and retest it.
We have support from the lower boundary of the ascending channel, at 0.05688.
We have a downtrend on the RSI indicator that is about to break and

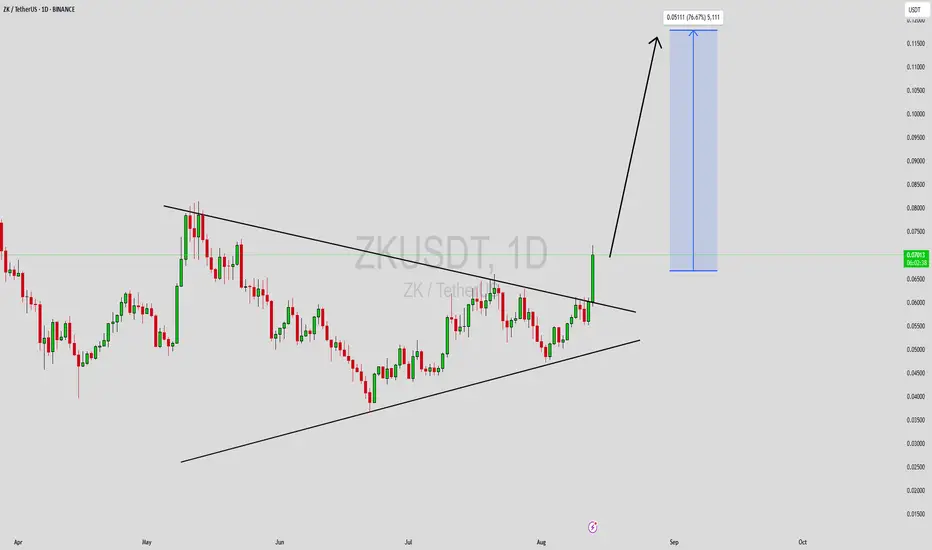
ZKUSDT Forming Symmetrical triangleZKUSDT has just broken out from a symmetrical triangle pattern, a technical formation that often signals a strong continuation move once resistance is breached. This breakout, supported by good trading volume, reflects growing bullish momentum as buyers step in with conviction. The projected potenti
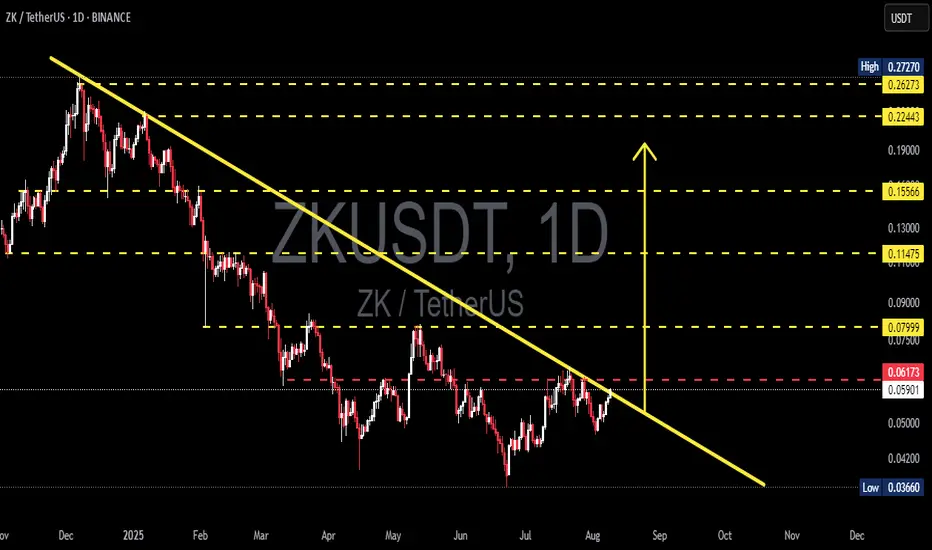
ZK/USDT — Testing Long-Term Downtrend: Breakout or Rejection at?Summary
The daily chart shows a clear long-term downtrend from the previous highs — the descending trendline (yellow) has been capping price action, forming a sequence of lower highs and lower lows. Currently, price is hovering around 0.0591 USDT, testing both the trendline resistance and a key hori
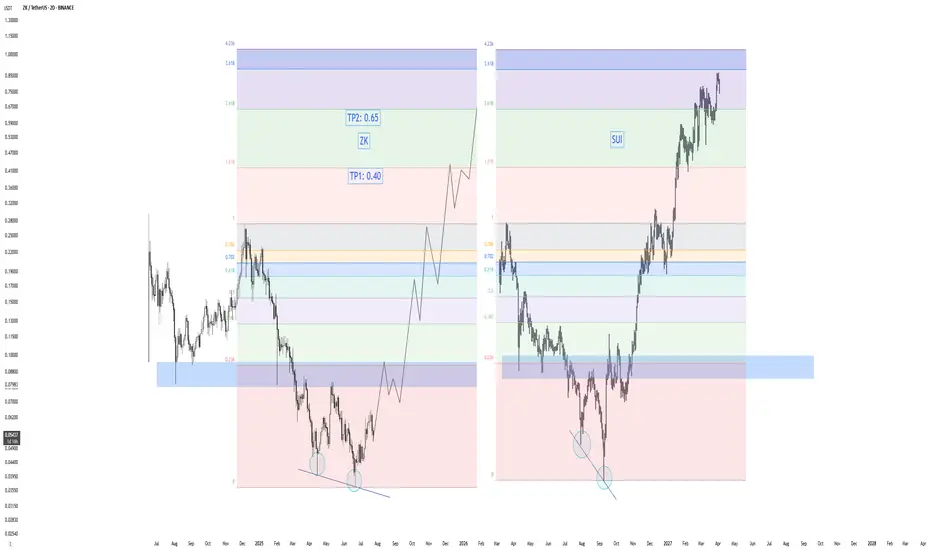
ZK - Golden opportunity? 0.40? Hello everyone, here’s my new analysis on ZK.
Recently, the price surged nearly 80%, followed by an 18% pullback over the last two days. From its all-time high, ZK is currently down about 80%, which in my opinion presents a golden opportunity.
Based on my research, the peaks of altseasons often oc
See all ideas
Summarizing what the indicators are suggesting.
Oscillators
Neutral
SellBuy
Strong sellStrong buy
Strong sellSellNeutralBuyStrong buy
Oscillators
Neutral
SellBuy
Strong sellStrong buy
Strong sellSellNeutralBuyStrong buy
Summary
Neutral
SellBuy
Strong sellStrong buy
Strong sellSellNeutralBuyStrong buy
Summary
Neutral
SellBuy
Strong sellStrong buy
Strong sellSellNeutralBuyStrong buy
Summary
Neutral
SellBuy
Strong sellStrong buy
Strong sellSellNeutralBuyStrong buy
Moving Averages
Neutral
SellBuy
Strong sellStrong buy
Strong sellSellNeutralBuyStrong buy
Moving Averages
Neutral
SellBuy
Strong sellStrong buy
Strong sellSellNeutralBuyStrong buy
Displays a symbol's price movements over previous years to identify recurring trends.