ZKUSDT — Descending Triangle Key Support, Breakout or Breakdown?Full Analysis
On the 2-day timeframe, ZKUSDT is forming a very clear descending triangle pattern:
Downtrend line (yellow) shows sellers’ dominance with consecutive lower highs.
Horizontal support zone (yellow box 0.0366 – 0.0531) is still being defended multiple times, showing that buyers are not
Related pairs

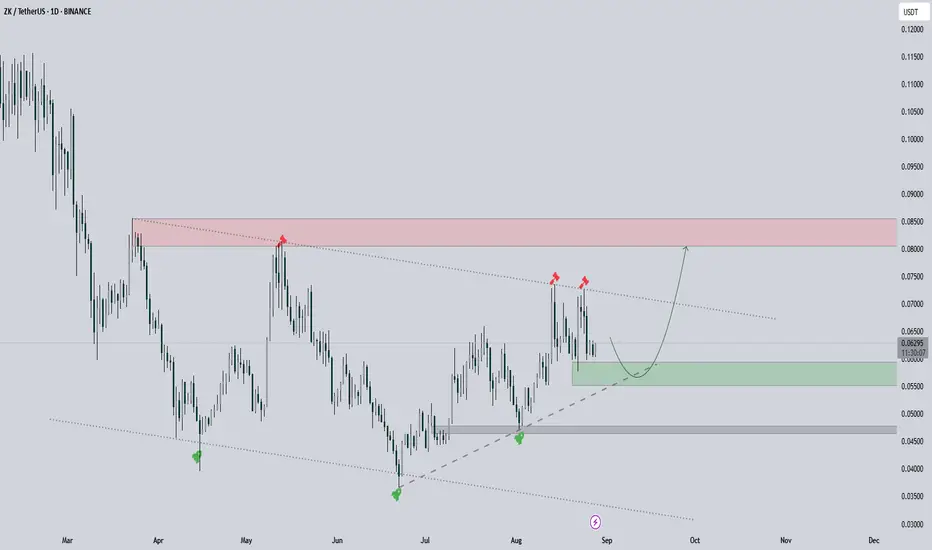
ZKUSDT | Range Defined by Blue and RedOn ZKUSDT, the blue box is acting as demand support while the red box marks firm resistance. For now, the structure is capped within this range.
I’m specifically watching the order flow:
Volume footprint shows clear absorption inside the blue box buyers quietly stacking bids.
CDV is still flat; I

ZK Secondary trend.-82% Wedge. Reversal zones. 01 05 2025Logarithm. Time frame 3 days. Decrease from listing about -82%. For cryptocurrencies of such liquidity and capitalization, this is not the maximum decrease (-90-96%). But sometimes from such values as now (-82-85%), taking into account the news hype during the listing "whales $ 458 million", a rev

ZK Breakout PotentialGiven its recent uptrend and second attempt to break resistance, BINANCE:ZKUSDT shows strong potential to decisively overcome its downtrend and initiate a significant upward wave. A closer look at the chart provides a more detailed perspective.
⛔ Disclaimer: No Guarantee of Profit or Loss
Please
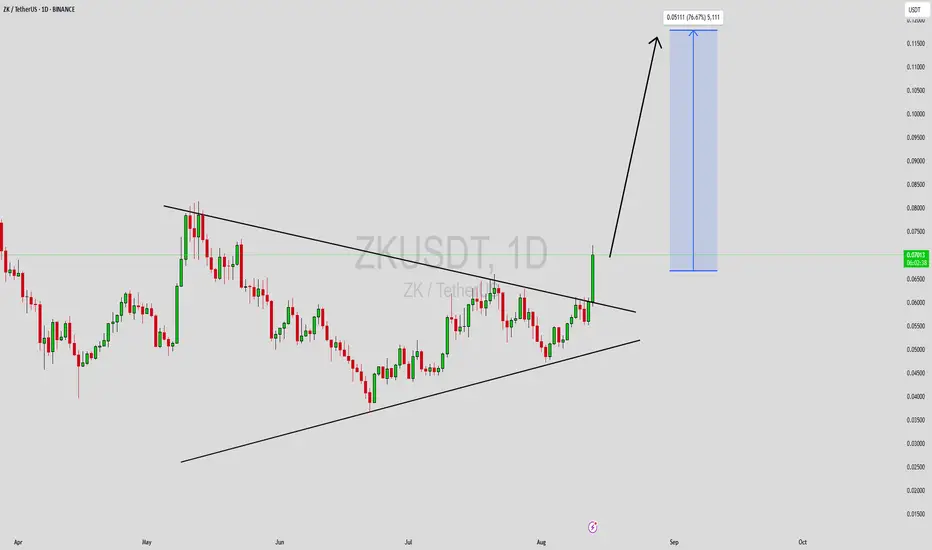
ZKUSDT - your capital will be doubled on thisIf you want to double your capital in a short period, then ZK is the coin to focus on.
-It’s still at the bottom.
-It formed a symmetrical triangle and already broke out, now doing a retest.
-There’s also an inverse head & shoulders pattern in play.
-Currently sitting right on the 25 EMA support

ZKUSDT 1D#ZK has broken above the descending trendline and completed a successful retest on the daily chart. It has also broken above the daily SMA200, which is a strong bullish sign. In case of a successful retest of the SMA200, the potential targets are:
🎯 $0.08057
🎯 $0.09415
🎯 $0.10773
🎯 $0.12707
🎯 $0.15

ZKUSDT Long Setup – Aug 15, 2025
ZKUSDT Long Setup – Aug 15, 2025
Entry: 0.06431
Target: 0.0733 (+15.2%)
Stop: 0.0620 (-3.5%)
R:R: 4.32
I'm currently in this after profiting from the peak formation short and then reversing for the longer term trend.
Why Long?
• Multi-timeframe structure: Higher lows forming on 4H, daily, and w

#ZK/USDT Trendline Break #ZK
The price is moving within an ascending channel on the 1-hour frame, adhering well to it, and is poised to break it strongly upwards and retest it.
We have support from the lower boundary of the ascending channel, at 0.05688.
We have a downtrend on the RSI indicator that is about to break and

ZKUSDT Forming Symmetrical triangleZKUSDT has just broken out from a symmetrical triangle pattern, a technical formation that often signals a strong continuation move once resistance is breached. This breakout, supported by good trading volume, reflects growing bullish momentum as buyers step in with conviction. The projected potenti
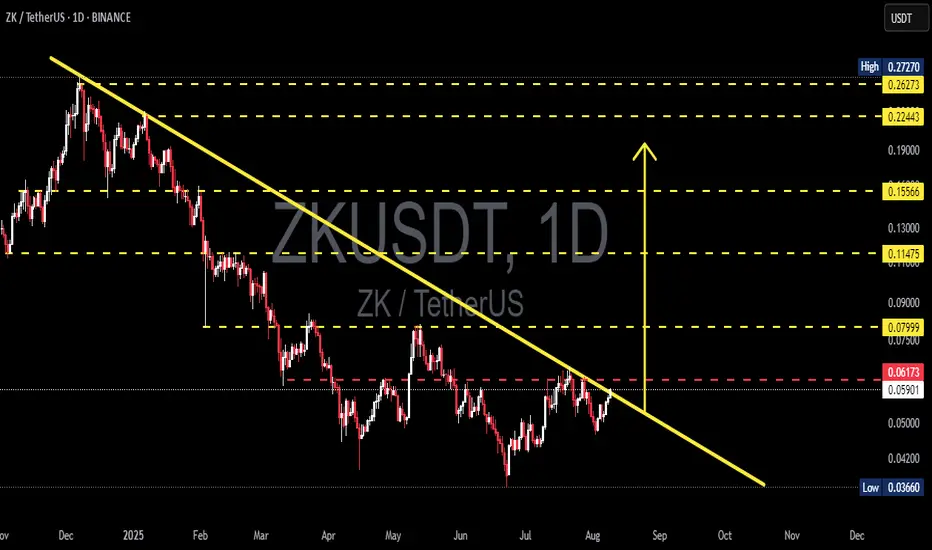
ZK/USDT — Testing Long-Term Downtrend: Breakout or Rejection at?Summary
The daily chart shows a clear long-term downtrend from the previous highs — the descending trendline (yellow) has been capping price action, forming a sequence of lower highs and lower lows. Currently, price is hovering around 0.0591 USDT, testing both the trendline resistance and a key hori
See all ideas
Summarizing what the indicators are suggesting.
Oscillators
Neutral
SellBuy
Strong sellStrong buy
Strong sellSellNeutralBuyStrong buy
Oscillators
Neutral
SellBuy
Strong sellStrong buy
Strong sellSellNeutralBuyStrong buy
Summary
Neutral
SellBuy
Strong sellStrong buy
Strong sellSellNeutralBuyStrong buy
Summary
Neutral
SellBuy
Strong sellStrong buy
Strong sellSellNeutralBuyStrong buy
Summary
Neutral
SellBuy
Strong sellStrong buy
Strong sellSellNeutralBuyStrong buy
Moving Averages
Neutral
SellBuy
Strong sellStrong buy
Strong sellSellNeutralBuyStrong buy
Moving Averages
Neutral
SellBuy
Strong sellStrong buy
Strong sellSellNeutralBuyStrong buy
Displays a symbol's price movements over previous years to identify recurring trends.
Frequently Asked Questions
The current price of ZKX / UST (ZKX) is 0.05053800 USDT — it has fallen −0.46% in the past 24 hours. Try placing this info into the context by checking out what coins are also gaining and losing at the moment and seeing ZKX price chart.
ZKX / UST price has fallen by −11.77% over the last week, its month performance shows a −22.12% decrease, and as for the last year, ZKX / UST has decreased by −67.02%. See more dynamics on ZKX price chart.
Keep track of coins' changes with our Crypto Coins Heatmap.
Keep track of coins' changes with our Crypto Coins Heatmap.
ZKX / UST (ZKX) reached its highest price on Jun 17, 2024 — it amounted to 1.00000000 USDT. Find more insights on the ZKX price chart.
See the list of crypto gainers and choose what best fits your strategy.
See the list of crypto gainers and choose what best fits your strategy.
ZKX / UST (ZKX) reached the lowest price of 0.03691900 USDT on Jun 22, 2025. View more ZKX / UST dynamics on the price chart.
See the list of crypto losers to find unexpected opportunities.
See the list of crypto losers to find unexpected opportunities.
The safest choice when buying ZKX is to go to a well-known crypto exchange. Some of the popular names are Binance, Coinbase, Kraken. But you'll have to find a reliable broker and create an account first. You can trade ZKX right from TradingView charts — just choose a broker and connect to your account.
Crypto markets are famous for their volatility, so one should study all the available stats before adding crypto assets to their portfolio. Very often it's technical analysis that comes in handy. We prepared technical ratings for ZKX / UST (ZKX): today its technical analysis shows the sell signal, and according to the 1 week rating ZKX shows the sell signal. And you'd better dig deeper and study 1 month rating too — it's sell. Find inspiration in ZKX / UST trading ideas and keep track of what's moving crypto markets with our crypto news feed.
ZKX / UST (ZKX) is just as reliable as any other crypto asset — this corner of the world market is highly volatile. Today, for instance, ZKX / UST is estimated as 3.41% volatile. The only thing it means is that you must prepare and examine all available information before making a decision. And if you're not sure about ZKX / UST, you can find more inspiration in our curated watchlists.
You can discuss ZKX / UST (ZKX) with other users in our public chats, Minds or in the comments to Ideas.