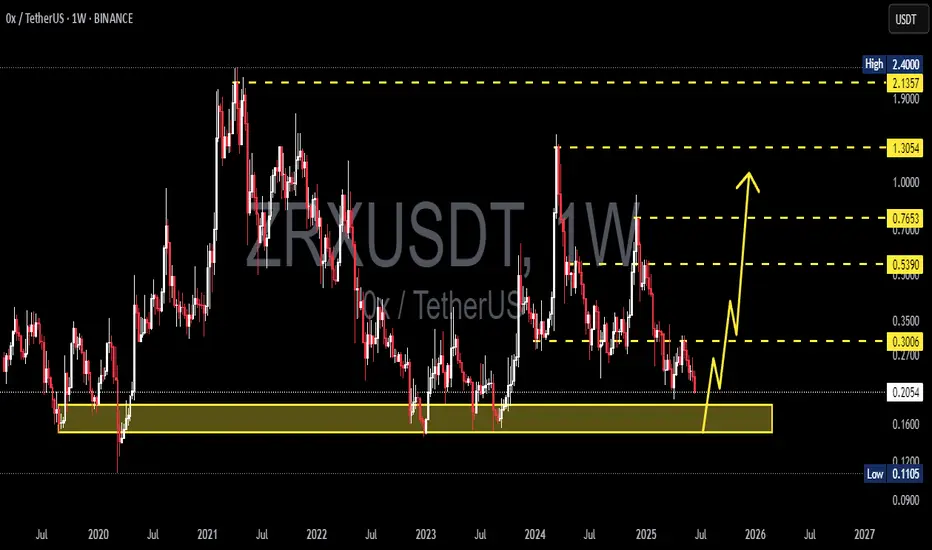
ZRX/USDT – Final Stage Before ReversalZRX/USDT appears to be entering the final stage before a major reversal. The recent move acted as a bear trap and liquidity sweep, effectively shaking out weak hands and resetting market sentiment.
Currently, price is consolidating within this zone, showing signs of accumulation as buyers gradually
ZRXUSDT UPDATE#ZRX
UPDATE
ZRX Technical Setup
Pattern : Bullish Falling Wedge Pattern
Current Price: $0.2612
Target Price: $0.62
Target % Gain: 140.67%
Technical Analysis: ZRX has broken out of a bullish falling wedge on the 1D chart, signaling potential reversal. A sustained close above $0.26 confirms bullis

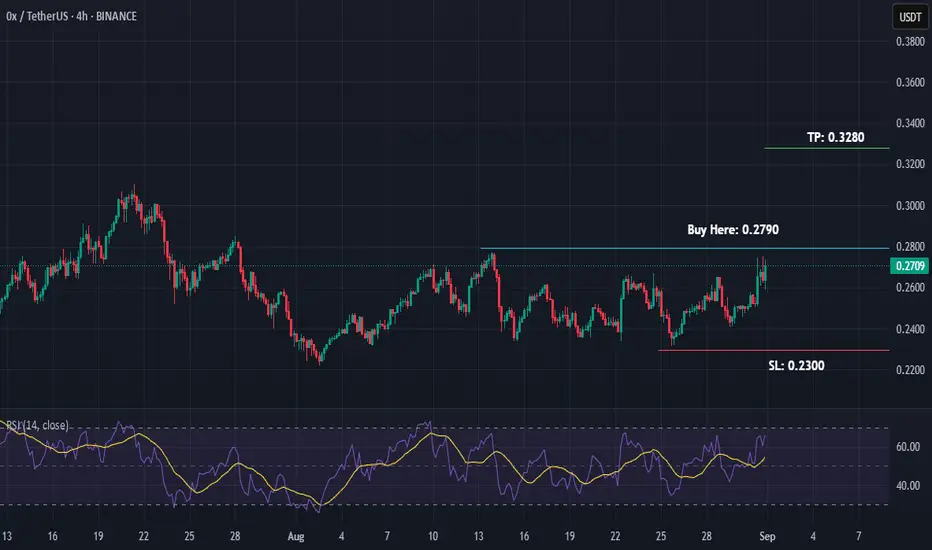
ZRX/USDT Buy-Stop on Range BreakoutZRX/USDT is in a range on 4H Timeframe.
We are taking a 1:1 trade from the breakout of this range.
Should be an easy one. Let's see how it goes.
ZRX Just Broke Out… But Is It a Bull Trap Before a Collapse?Yello Paradisers did you catch that breakout from the falling wedge, or are you about to get faked out like the rest?
💎#ZRX/USDT has finally broken out of its descending resistance after weeks of compression. While this is a promising signal, this move alone is not enough. What really matters now

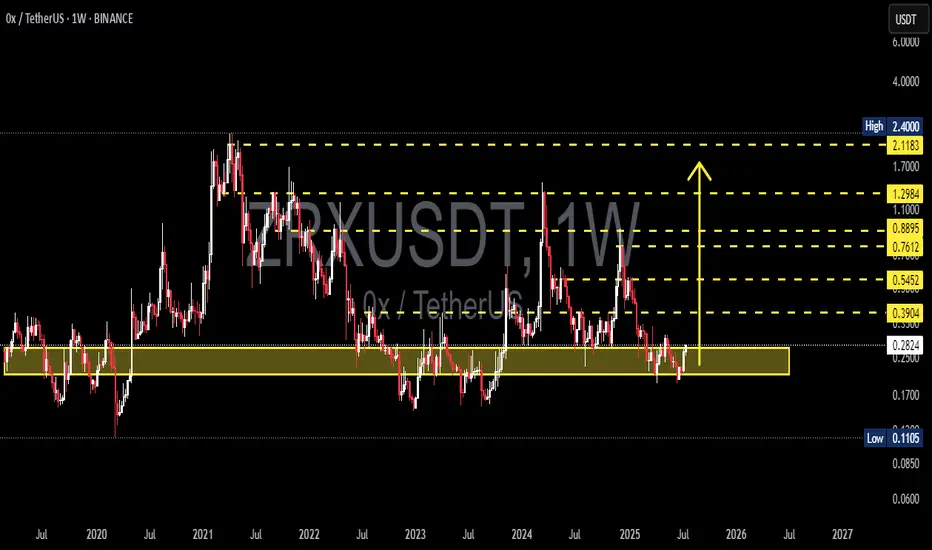
ZRXUSDT Weekly Analysis – Major Reversal Brewing from Multi-Year🔍 Technical Overview:
ZRX (0x Protocol) is currently showing strong signs of a long-term accumulation phase, with price once again revisiting a critical historical demand zone between $0.25 and $0.30. This area has acted as solid support multiple times since 2019, and the current structure suggests
ZRX Looks Bullish (2D)From the point where we placed the red arrow on the chart, it appears that a triangle is forming.
Now, considering the formation of a double bottom at the low and the break of the bearish trendline, it seems that the price is ready to complete wave E of this triangle.
As long as the new demand zon

ZRXUSDT 1W AnalysisZRX ~ 1W Analysis
#ZRX If you still have faith in this coin. You can consider this support to start buying back from here with a short-term target of at least 20%++
#ZRX/USDT#ZRX
The price is moving within a descending channel on the 1-hour frame, adhering well to it, and is heading towards a strong breakout and retest.
We are experiencing a rebound from the lower boundary of the descending channel. This support is at 0.2175.
We are experiencing a downtrend on the RSI

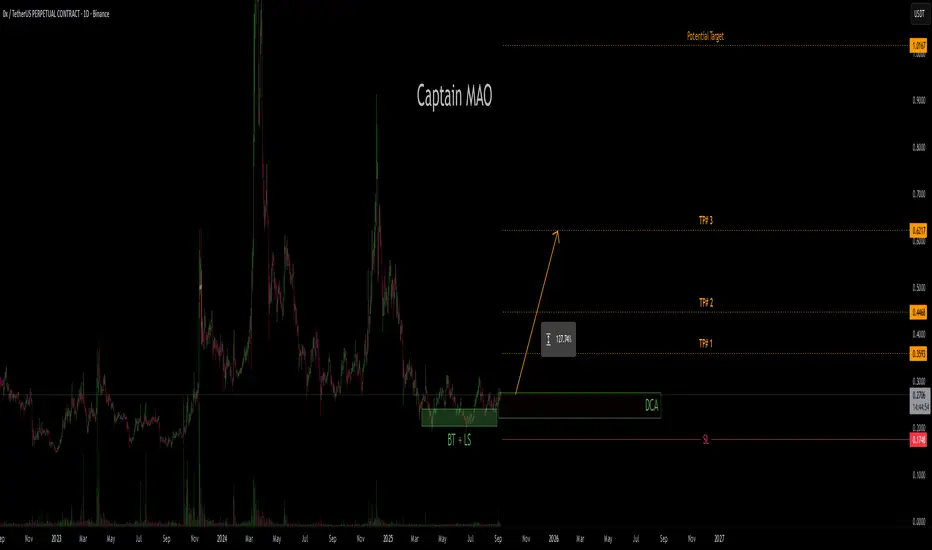
0X New Bullish Impulse, New All-Time High Late 2025I see bullish market conditions with a long-term growing base. Each time there is a correction, or bear market, the end price of the move is higher compared to the previous cycle.
The all-time high remains in 2021. This never breaks. There has been some bullish waves but not enough to break the 202

ZRXUSDT 1D AnalysisZRX ~ 1D Analysis
#ZRX Buy gradually after successfully breaking through this resistance line with a short-term target of at least 10%++.

See all ideas
Summarizing what the indicators are suggesting.
Oscillators
Neutral
SellBuy
Strong sellStrong buy
Strong sellSellNeutralBuyStrong buy
Oscillators
Neutral
SellBuy
Strong sellStrong buy
Strong sellSellNeutralBuyStrong buy
Summary
Neutral
SellBuy
Strong sellStrong buy
Strong sellSellNeutralBuyStrong buy
Summary
Neutral
SellBuy
Strong sellStrong buy
Strong sellSellNeutralBuyStrong buy
Summary
Neutral
SellBuy
Strong sellStrong buy
Strong sellSellNeutralBuyStrong buy
Moving Averages
Neutral
SellBuy
Strong sellStrong buy
Strong sellSellNeutralBuyStrong buy
Moving Averages
Neutral
SellBuy
Strong sellStrong buy
Strong sellSellNeutralBuyStrong buy
Displays a symbol's price movements over previous years to identify recurring trends.