Dollar - Daily CLS - Model 1 - HTF FrameworkHi friends, new range created. As always we are looking for the manipulation in to the key level around the range. Don't forget confirmation switch from manipulation phase to the distribution phase to make the setup valid. Stay patient and enter only after change in order flow. If price reaches 50%
U.S. Dollar Index
No trades
About U.S. Dollar Index
The U.S. Dollar Index tracks the strength of the dollar against a basket of major currencies. DXY was originally developed by the U.S. Federal Reserve in 1973 to provide an external bilateral trade-weighted average value of the U.S. dollar against global currencies. U.S. Dollar Index goes up when the U.S. dollar gains "strength" (value), compared to other currencies. The following six currencies are used to calculate the index:
Euro (EUR) 57.6% weight
Japanese yen (JPY) 13.6% weight
Pound sterling (GBP) 11.9% weight
Canadian dollar (CAD) 9.1% weight
Swedish krona (SEK) 4.2% weight
Swiss franc (CHF) 3.6% weight
Euro (EUR) 57.6% weight
Japanese yen (JPY) 13.6% weight
Pound sterling (GBP) 11.9% weight
Canadian dollar (CAD) 9.1% weight
Swedish krona (SEK) 4.2% weight
Swiss franc (CHF) 3.6% weight
Related indices

11.02.26 Daily ForecastPairs on Watch -
FX:NZDUSD
FX:EURCAD
A short overview of the instruments I am looking at for today, multi-timeframe analysis down to what I will be looking at for an entry. Enjoy!

US DOLLAR INDEX (DXY): Classic Breakout TradeThe Dollar Index successfully broke and closed above a significant daily horizontal resistance cluster earlier this week.
Following this, the pair started to consolidate on a 4-hour timeframe, retesting the previously breached structure.
A bullish breakout of this consolidation serve as a strong

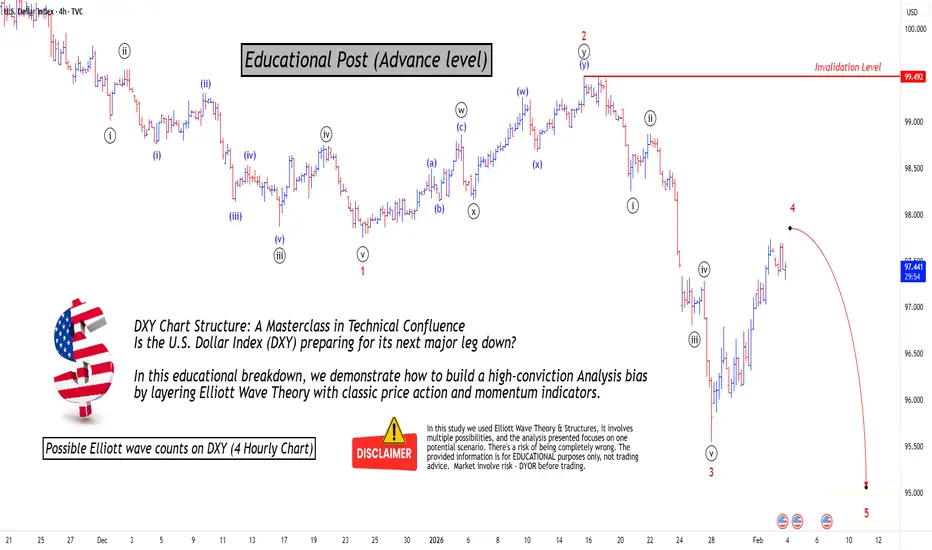
Mastering Technical:DXY Elliott Wave & Multi-Indicators AnalysisTechnical Analysis: DXY Bearish Confluence
This post serves as an educational guide on how various technical analysis tools converge to suggest a strong potential for a continued downtrend in the U.S. Dollar Index (DXY) on the 4-hour timeframe.
Elliott Wave Structure & Bearish Bias
The prevail
Falling towards overlap support?US Dollar Index (DXY) is falling towards the pivot, which has been identified as an overlap support that aligns with the 61.8% Fibonacci retracement.
Pivot: 96.43
1st Support: 96.05
1st Resistance: 97.23
Disclaimer:
The opinions given above constitute general market commentary and do not constit

If BUY Bias on DXY On lower Daily timeframe there is an ABCDE expanding triangle patten right along the Weekly up trend S&R and Weekly horizontal S&R ..So now am waiting for cross above the 101 to confirm long term BUY BIAS

Dxy about to fall Dxy is retesting the breakdown when it's complete it should start to fall 91 - 90 is the Target.

DXY – H4 | Short-Side Technical ContextThe U.S. Dollar Index recently completed a corrective bullish channel following a strong impulsive decline. Price respected the rising channel structure but failed to sustain acceptance near the upper boundary, indicating weak continuation strength.
A decisive move lower has now occurred, with pric

Bearish reversal off pullback resistance?US Dollar Index (DXY) is rising towards the pivot, which acts as a pullback resistance and could reverse to the 1st support.
Pivot: 97.85
1st Support: 96.44
1st Resistance: 98.70
Disclaimer:
The opinions given above constitute general market commentary and do not constitute the opinion or advice

Sell the USDFed will cut rates. Deleveraging events always pushed the Fed to cut regardless of who is Chair.
Buy 5 year bonds, not the back end. US debt burden will keep long rates elevated.
US is not a safe haven anymore = only EUR can fill that gap. Sell USD. Buy EUR, GBP,CHF,CAD,AUD.
Most currency trends ar

See all ideas
Summarizing what the indicators are suggesting.
Oscillators
Neutral
SellBuy
Strong sellStrong buy
Strong sellSellNeutralBuyStrong buy
Oscillators
Neutral
SellBuy
Strong sellStrong buy
Strong sellSellNeutralBuyStrong buy
Summary
Neutral
SellBuy
Strong sellStrong buy
Strong sellSellNeutralBuyStrong buy
Summary
Neutral
SellBuy
Strong sellStrong buy
Strong sellSellNeutralBuyStrong buy
Summary
Neutral
SellBuy
Strong sellStrong buy
Strong sellSellNeutralBuyStrong buy
Moving Averages
Neutral
SellBuy
Strong sellStrong buy
Strong sellSellNeutralBuyStrong buy
Moving Averages
Neutral
SellBuy
Strong sellStrong buy
Strong sellSellNeutralBuyStrong buy
Displays a symbol's value movements over previous years to identify recurring trends.
Frequently Asked Questions
The current value of U.S. Dollar Index is 96.819 USD — it has fallen by −0.02% in the past 24 hours. Track the index more closely on the U.S. Dollar Index chart.
U.S. Dollar Index reached its highest quote on Feb 25, 1985 — 164.720 USD. See more data on the U.S. Dollar Index chart.
The lowest ever quote of U.S. Dollar Index is 70.698 USD. It was reached on Mar 17, 2008. See more data on the U.S. Dollar Index chart.
U.S. Dollar Index value has decreased by −0.57% in the past week, since last month it has shown a −2.31% decrease, and over the year it's decreased by −10.36%. Keep track of all changes on the U.S. Dollar Index chart.
U.S. Dollar Index is just a number that lets you track performance of the instruments comprising the index, so you can't invest in it directly. But you can buy U.S. Dollar Index futures or funds or invest in its components.