GBP/USD - H4 Weekly Outlook- Channel Breakout📝 Description 🔍 Setup (Market Structure) OANDA:GBPUSD
GBP/USD is trading inside a rising channel on H4 and has recently shown a channel breakout attempt followed by a retest near the upper zone. Price is now consolidating under a key resistance area, making this a decision week.
🔴Higher highs &
British Pound / U.S. Dollar
No trades
About British Pound / U.S. Dollar
GBPUSD, often referred to as “The Cable”, a foreign exchange term used to describe the British pound vs the US dollar, is one of the oldest traded currency pairs. In July of 1866, after an earlier failed attempt, the first reliable exchange rate between the British pound and the US dollar was transmitted between the London and New York Exchanges. Optic fibre cables accompanied by satellites handle the Transatlantic communications today.
Related currencies

GBPUSD I Weekly CLS Model 1 - Key Level FVG + SMTHi friends, new range created. As always we are looking for the manipulation in to the key level around the range. Don't forget confirmation switch from manipulation phase to the distribution phase to make the setup valid. Stay patient and enter only after change in order flow. If price reaches 50%

GBPUSD - Relief Rally Into Resistance? Sellers Watching Closely📉GBPUSD remains overall bearish on the higher timeframe. Price is still trading within a descending structure, and the broader trend continues to favor sellers rather than buyers.
The recent upside move is best viewed as a corrective bounce, not a trend reversal. Price is now approaching a key con

GBP/USD | BSLs ahead! (READ THE CAPTION)As you can see in the hourly chart of GBPUSD, it has broken through both the FVG and IFVG and is now in the supply zone. There are BuySide Liquidities above at 1.34466 and 1.34559 which I expect to be swept away.
Mind the fact that we don't have any impactful news today and is practically the last

GBPUSD at wait-and-react area.Price just pushed higher aggressively. That move corrected a large portion of the prior bearish leg. And just tapped back into a major resistance zone. This is a key decision point.
At this level, I’m not interested in chasing longs. Price is extended into resistance. So, if buyers fail to hold ab

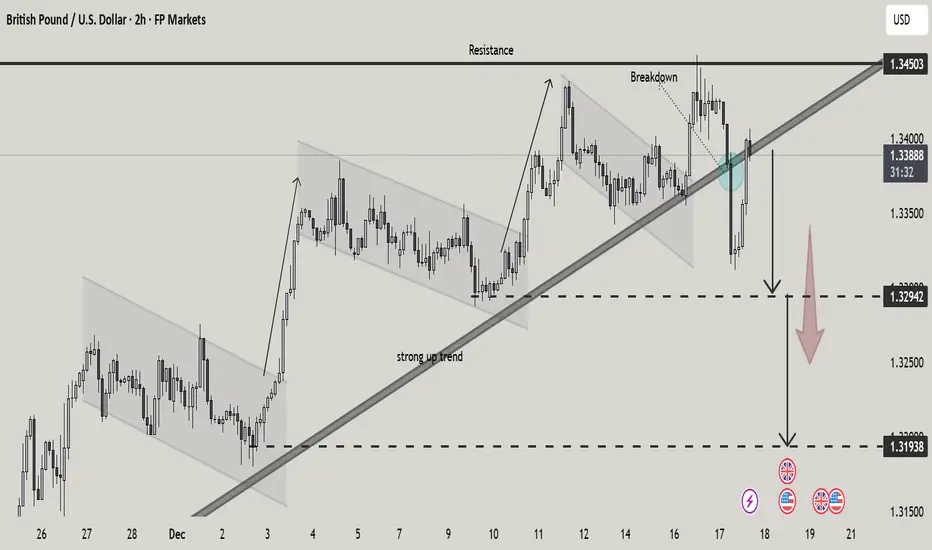
GBPUSD Trendline Breakdown Deeper Pullback from Key ResistanceThis 2-hour GBP/USD chart highlights a strong bullish structure built on a rising trendline, with price respecting higher lows throughout early December. Multiple ascending and corrective channels show controlled upside momentum.
Price recently tested a major resistance zone near 1.3450, failed to h
GBP/USD Short SetupThe GBP/USD 3-hour chart shows price consolidating within two converging descending trend lines. The Ichimoku cloud remains supportive, maintaining an overall bullish bias, while the current structure hints at a potential reversal. The current price is 1.33946. Two downside targets are highlighted o

Hellena | GBP/USD (4H): LONG to resistance area of 1.34683.Colleagues, the upward movement is actively developing, and I see a medium-term upward impulse (12345) developing in the higher wave “1” (red).
At this stage, I see:
1) the possibility of a correction in wave “4” in the area of 1.32440, then reaching the resistance area of 1.34683.
2) the extension

GBP/USD – H2 Analysis....GBP/USD – H2 Analysis (As per My chart)
Market Structure
Price is moving inside a clear ascending channel.
Trend remains bullish with higher highs and higher lows.
Recent pullback found support near the lower channel + Ichimoku cloud, showing buyers are active.
Momentum suggests continuation to

GBP/USD Ready for a Year–End Breakout?Daily Technical Analysis
GBP/USD is currently trading around the 1.337 area, holding above a rising channel structure after breaking through the 1.322 demand zone at the start of December. Recent daily candles show slowing bullish momentum under a higher–timeframe supply zone extending toward 1.345

See all ideas
Summarizing what the indicators are suggesting.
Oscillators
Neutral
SellBuy
Strong sellStrong buy
Strong sellSellNeutralBuyStrong buy
Oscillators
Neutral
SellBuy
Strong sellStrong buy
Strong sellSellNeutralBuyStrong buy
Summary
Neutral
SellBuy
Strong sellStrong buy
Strong sellSellNeutralBuyStrong buy
Summary
Neutral
SellBuy
Strong sellStrong buy
Strong sellSellNeutralBuyStrong buy
Summary
Neutral
SellBuy
Strong sellStrong buy
Strong sellSellNeutralBuyStrong buy
Moving Averages
Neutral
SellBuy
Strong sellStrong buy
Strong sellSellNeutralBuyStrong buy
Moving Averages
Neutral
SellBuy
Strong sellStrong buy
Strong sellSellNeutralBuyStrong buy
Displays a symbol's price movements over previous years to identify recurring trends.
Frequently Asked Questions
The current rate of GBPUSD is 1.35079 USD — it has increased by 0.11% in the past 24 hours. See more of GBPUSD rate dynamics on the detailed chart.
The value of the GBPUSD pair is quoted as 1 GBP per x USD. For example, if the pair is trading at 1.50, it means it takes 1.5 USD to buy 1 GBP.
The term volatility describes the risk related to the changes in an asset's value. GBPUSD has the volatility rating of 0.26%. Track all currencies' changes with our live Forex Heatmap and prepare for markets volatility.
The GBPUSD showed a 0.85% rise over the past week, the month change is a 3.34% rise, and over the last year it has increased by 7.80%. Track live rate changes on the GBPUSD chart.
Learn how you can make money on rate changes in numerous trading ideas created by our community.
Learn how you can make money on rate changes in numerous trading ideas created by our community.
GBPUSD is a major currency pair, i.e. a popular currency paired with USD.
Currencies are usually traded through forex brokers — choose the one that suits your needs and go ahead. You can trade GBPUSD right from TradingView charts — just log in to you broker account. Check out the list of our integrated brokers and find the best one for your needs and strategy.
When deciding to buy or sell currency one should keep in mind many factors including current geopolitical situation, interest rates, and other. But before plunging into a deep research, you can start with GBPUSD technical analysis. The technical rating for the pair is buy today, but don't forget that markets can be very unstable, so don't stop here. According to our 1 week rating the GBPUSD shows the strong buy signal, and 1 month rating is buy. See more of GBPUSD technicals for a more comprehensive analysis.