NZDCAD–Breakout From the Downward Channel With Bullish PotentialOn the 4H timeframe, price has broken out of its long-term descending channel and is currently testing the key resistance at 0.8060.
Price action in this area shows that bullish momentum is increasing, and if this resistance is broken decisively, we could see further upward movement toward higher le
NZD/CAD
No trades
Related currencies

TestTest S&F
Weekly Trend
Bearish
Identify overall market trend and structure
Price at OR rejected W-AOI
Identify valid order blocks
W - Rejection Previous Structure Level
W Rejection Previous Structure Level
W Rejection Candlestick
W Break & Retest / Head & Shoulders Pattern
W Break & Retest / Head
#NZDCAD: Classic Trend Following PatternThe NZDCAD pair recently violated a significant intraday horizontal resistance level, and closed above it.
Upon retesting this previously broken structure, the price then broke above the resistance line of a falling wedge pattern on an hourly timeframe.
This suggests a strong potential for bullish

NZDCAD – Sell Trade IdeaNZDCAD – Sell Trade Idea 📉🔥
I’m looking for a sell setup on NZDCAD as the pair keeps showing strong bearish momentum. Sellers are taking control 💣 — price is making lower highs and lower lows, and momentum is still pushing down.
NZD is under pressure 😬 from softer risk sentiment and weaker domestic

Bullish bounce?NZD/CAD has bounced off the pivot, a pullback support that aligns with the 38.2% Fibonacci retracement, and could rise to the 1st resistance.
Pivot: 0.7977
1st Support: 0.7943
1st Resistance: 0.8063
Disclaimer:
The opinions given above constitute general market commentary and do not constitute t

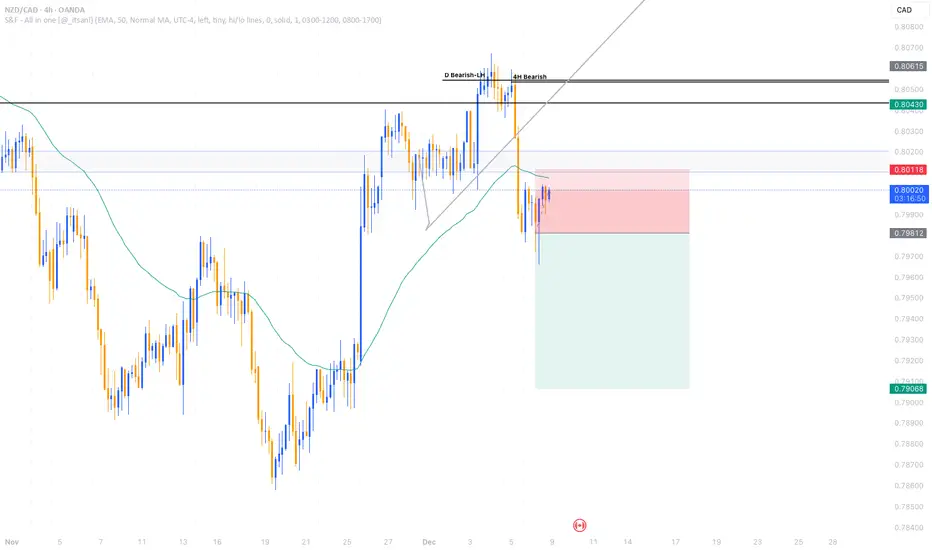
NZDCAD SHORT Market structure bearish at HTFs 3
Entry at both Weekly And Daily AOi
Weekly Rejection at AOi
Previous Weekly Structure Point
Daily Rejection at AOi
Daily EMA retest
Around Psychological Level 0.80000
Touching EMA H4
H4 Candlestick rejection
TP: WHO KNOWS!
Entry 115%
REMEMBER : Trading is a Ga

NZDCAD at support buy it Long NZDCAD after a bull run is corrected well price reached the support . Take a long position . Let us see how it plays out.

NZDCAD shortNZDCAD has been bearish for a while now.The weekly,daily and 4 hour timeframes are bearish and all I was looking for was the retest of the supply zone and a continuation signal to continue with the sells.The retest has happened and the bearish engulfing candlestick on the four hour timeframe confir

buy nzdcadthere was an entry yesterday but i was scared to enter. lol. today presents itself with another opportunity. bet responsibly and all the best. risk to reward is 1:3

NZDCAD: Watch this Key Support reactionPrice has been in a steady downtrend for a long while, respecting that descending trendline over and over again. Every touch was sold off, until recently. When price reached a key support zone and sent price back upward. The reaction from that area is visibly strong.
We then got a clean breakout a

See all ideas
Summarizing what the indicators are suggesting.
Oscillators
Neutral
SellBuy
Strong sellStrong buy
Strong sellSellNeutralBuyStrong buy
Oscillators
Neutral
SellBuy
Strong sellStrong buy
Strong sellSellNeutralBuyStrong buy
Summary
Neutral
SellBuy
Strong sellStrong buy
Strong sellSellNeutralBuyStrong buy
Summary
Neutral
SellBuy
Strong sellStrong buy
Strong sellSellNeutralBuyStrong buy
Summary
Neutral
SellBuy
Strong sellStrong buy
Strong sellSellNeutralBuyStrong buy
Moving Averages
Neutral
SellBuy
Strong sellStrong buy
Strong sellSellNeutralBuyStrong buy
Moving Averages
Neutral
SellBuy
Strong sellStrong buy
Strong sellSellNeutralBuyStrong buy
Displays a symbol's price movements over previous years to identify recurring trends.
Frequently Asked Questions
The current rate of NZDCAD is 0.79885 CAD — it has decreased by −0.21% in the past 24 hours. See more of NZDCAD rate dynamics on the detailed chart.
The value of the NZDCAD pair is quoted as 1 NZD per x CAD. For example, if the pair is trading at 1.50, it means it takes 1.5 CAD to buy 1 NZD.
The term volatility describes the risk related to the changes in an asset's value. NZDCAD has the volatility rating of 0.41%. Track all currencies' changes with our live Forex Heatmap and prepare for markets volatility.
The NZDCAD showed a −0.77% fall over the past week, the month change is a 0.78% rise, and over the last year it has decreased by −2.41%. Track live rate changes on the NZDCAD chart.
Learn how you can make money on rate changes in numerous trading ideas created by our community.
Learn how you can make money on rate changes in numerous trading ideas created by our community.
NZDCAD is a minor currency pair, i.e. a popular pair that is not associated with USD. Such pairs are also called cross currency pairs.
Currencies are usually traded through forex brokers — choose the one that suits your needs and go ahead. You can trade NZDCAD right from TradingView charts — just log in to you broker account. Check out the list of our integrated brokers and find the best one for your needs and strategy.
When deciding to buy or sell currency one should keep in mind many factors including current geopolitical situation, interest rates, and other. But before plunging into a deep research, you can start with NZDCAD technical analysis. The technical rating for the pair is sell today, but don't forget that markets can be very unstable, so don't stop here. According to our 1 week rating the NZDCAD shows the sell signal, and 1 month rating is sell. See more of NZDCAD technicals for a more comprehensive analysis.