Welcome a major new addition to the TradingView tools — Fundamental Graphs. Created to enhance your fundamental analysis, this feature enables seamless comparison of key financial metrics across multiple companies — all on a single chart that you can tailor to your needs.

With Fundamental Graphs, you can now make more informed decisions by visually comparing critical company data in one handy interface. Whether you’re analyzing EPS, revenue, or other fundamentals, this tool empowers you to find insights you need and build a more reliable investment strategy based on real data.
To get started, simply navigate to the Products menu and select Fundamental Graphs.

The graphs’ interface is designed for maximum flexibility and clarity. You will be setting your chart from the left tool panel: let’s see what you can customize there to maximize your experience with the tool.
Symbol and metric selection
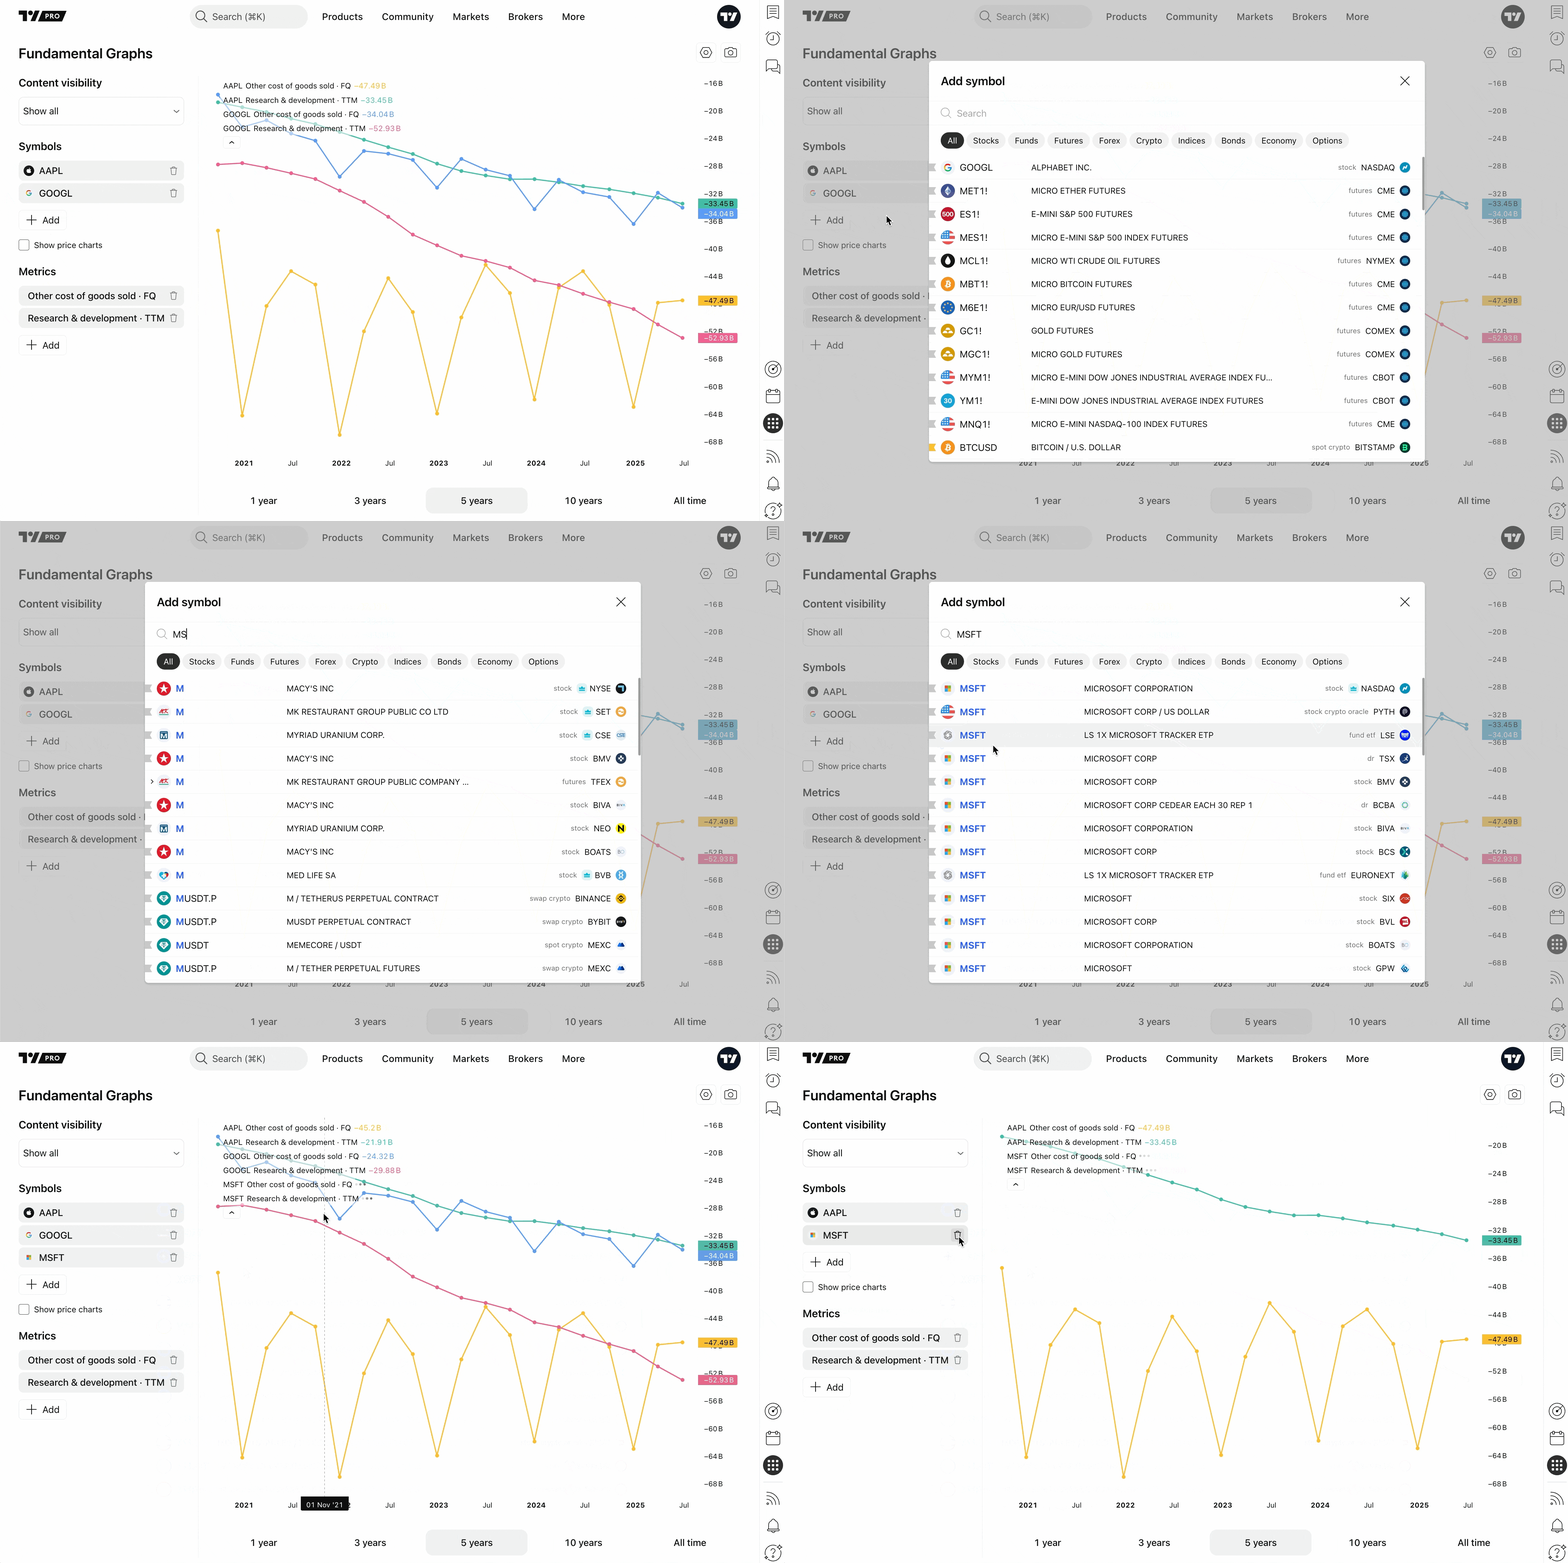
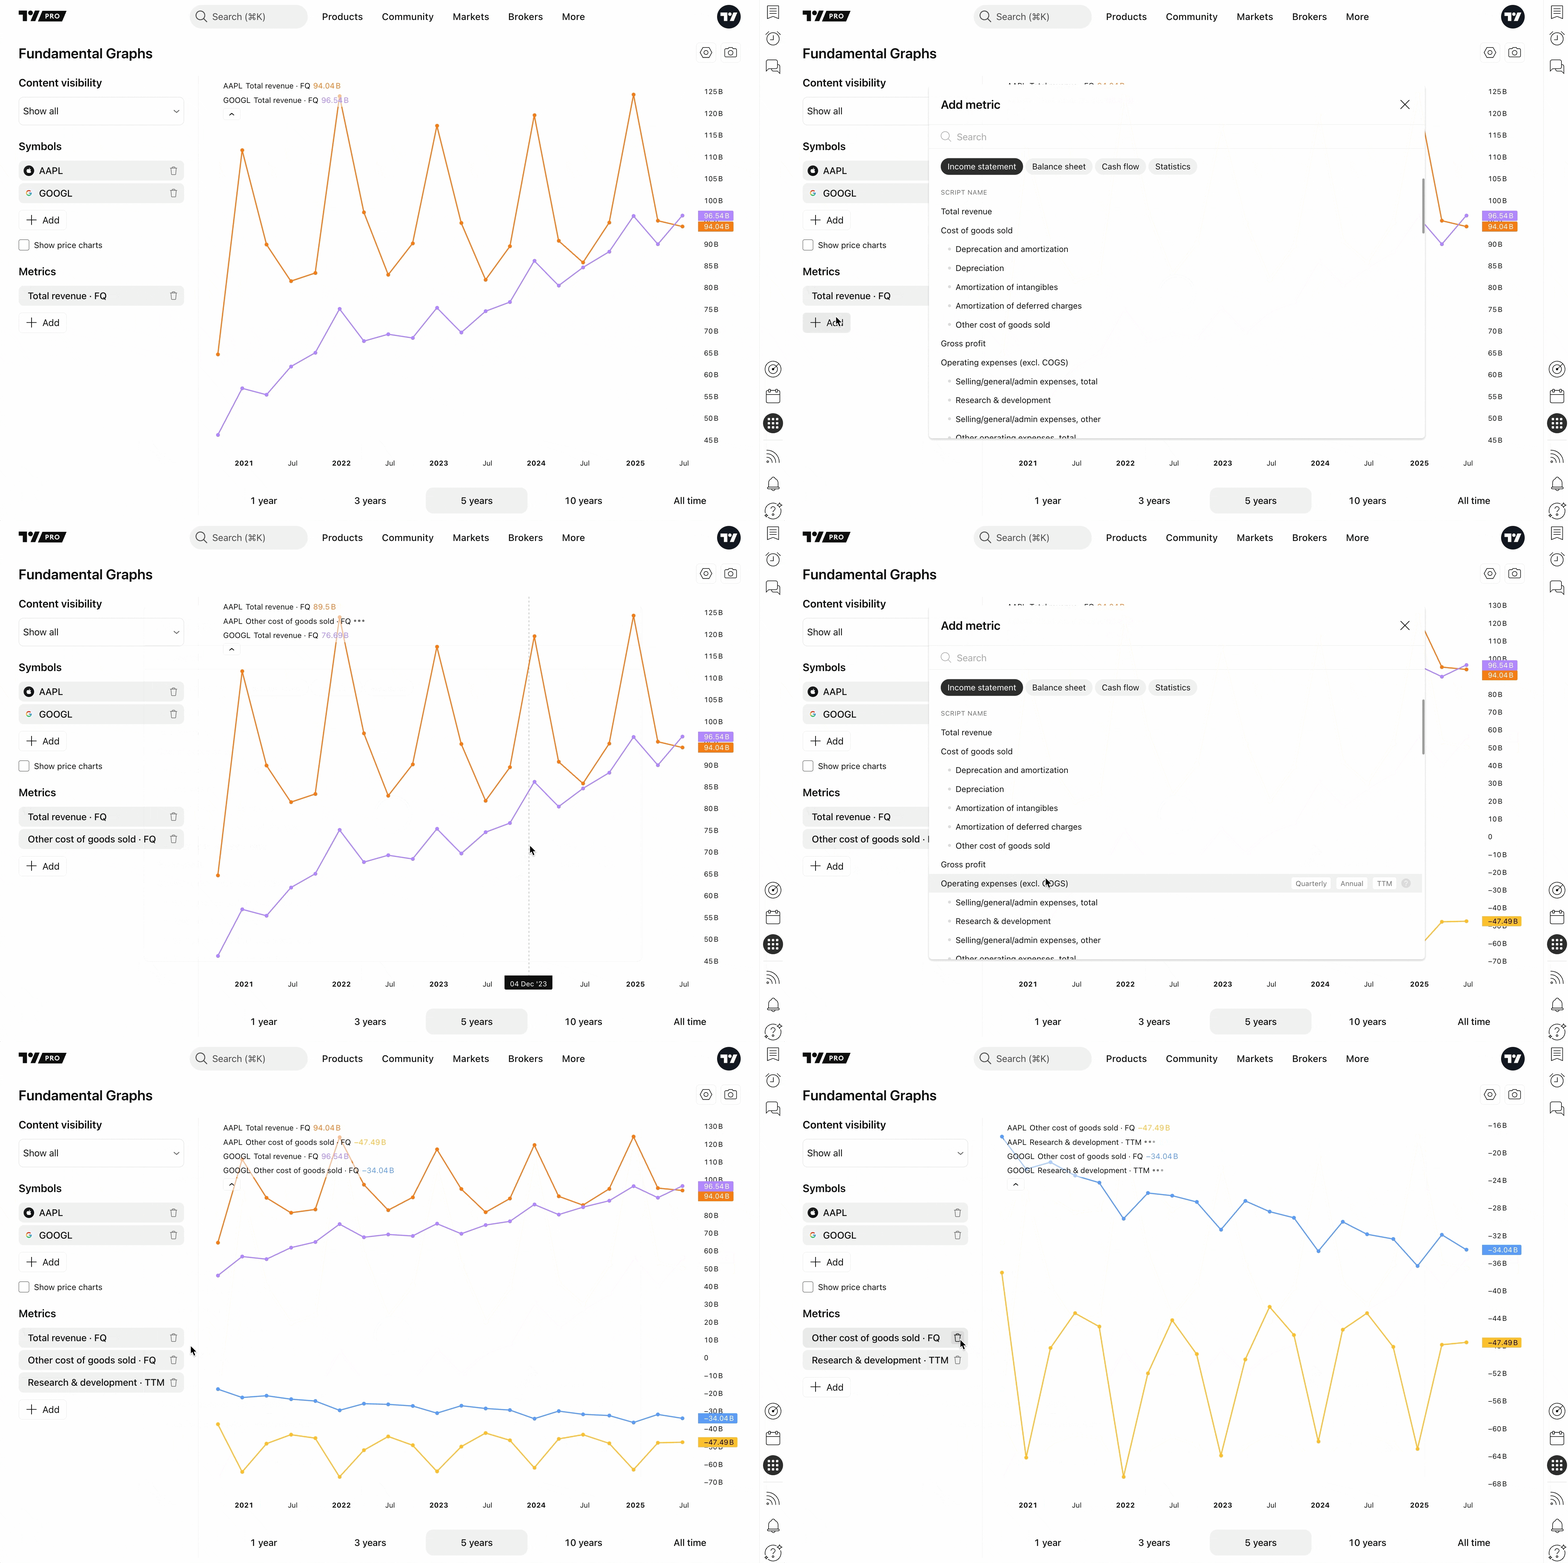
Add or remove up to nine symbols and nine different metrics at once to compare performance across companies and timeframes.


Dynamic view modes
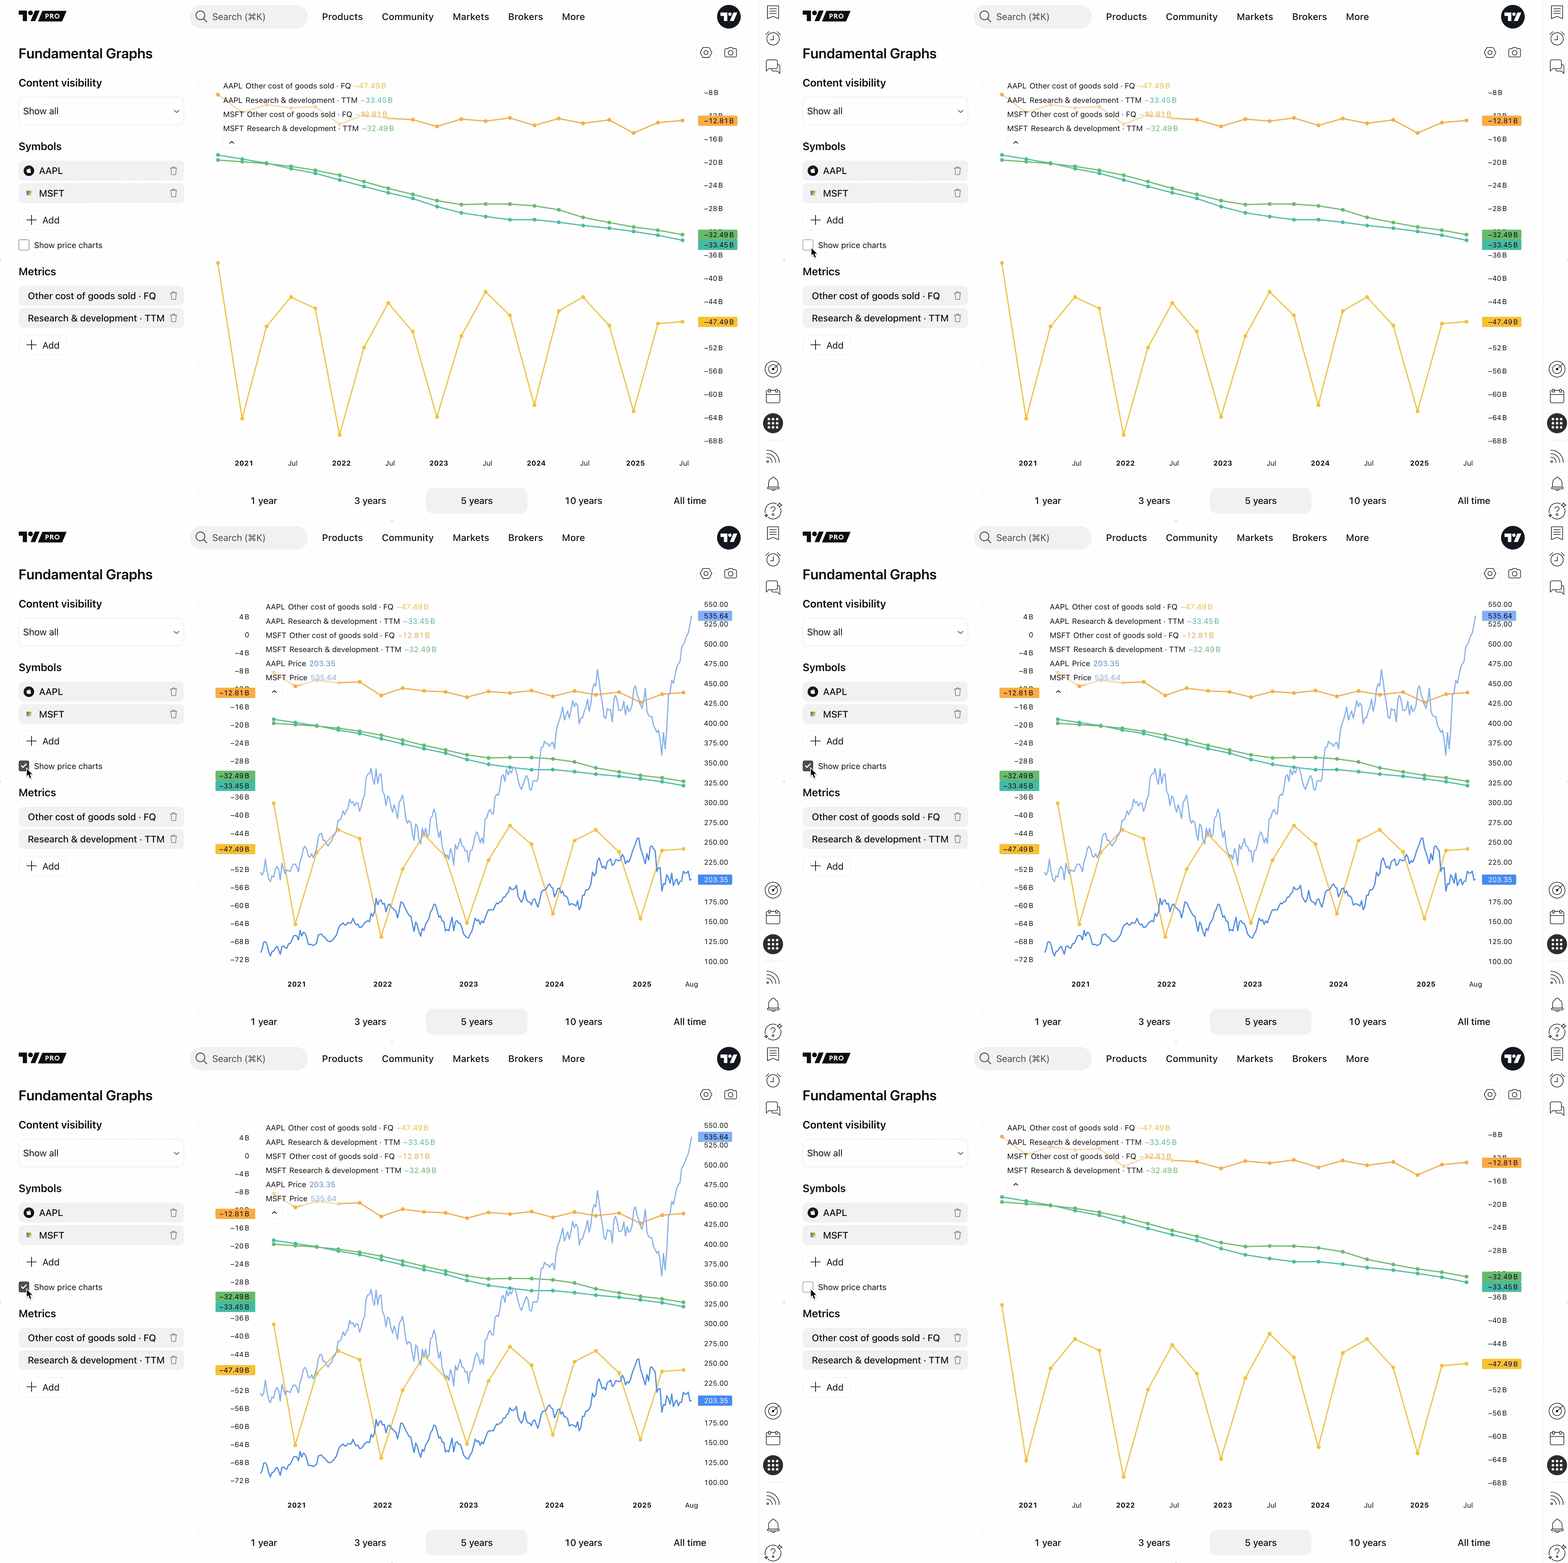
You can enable or disable price charts to better isolate and examine the underlying fundamental data.

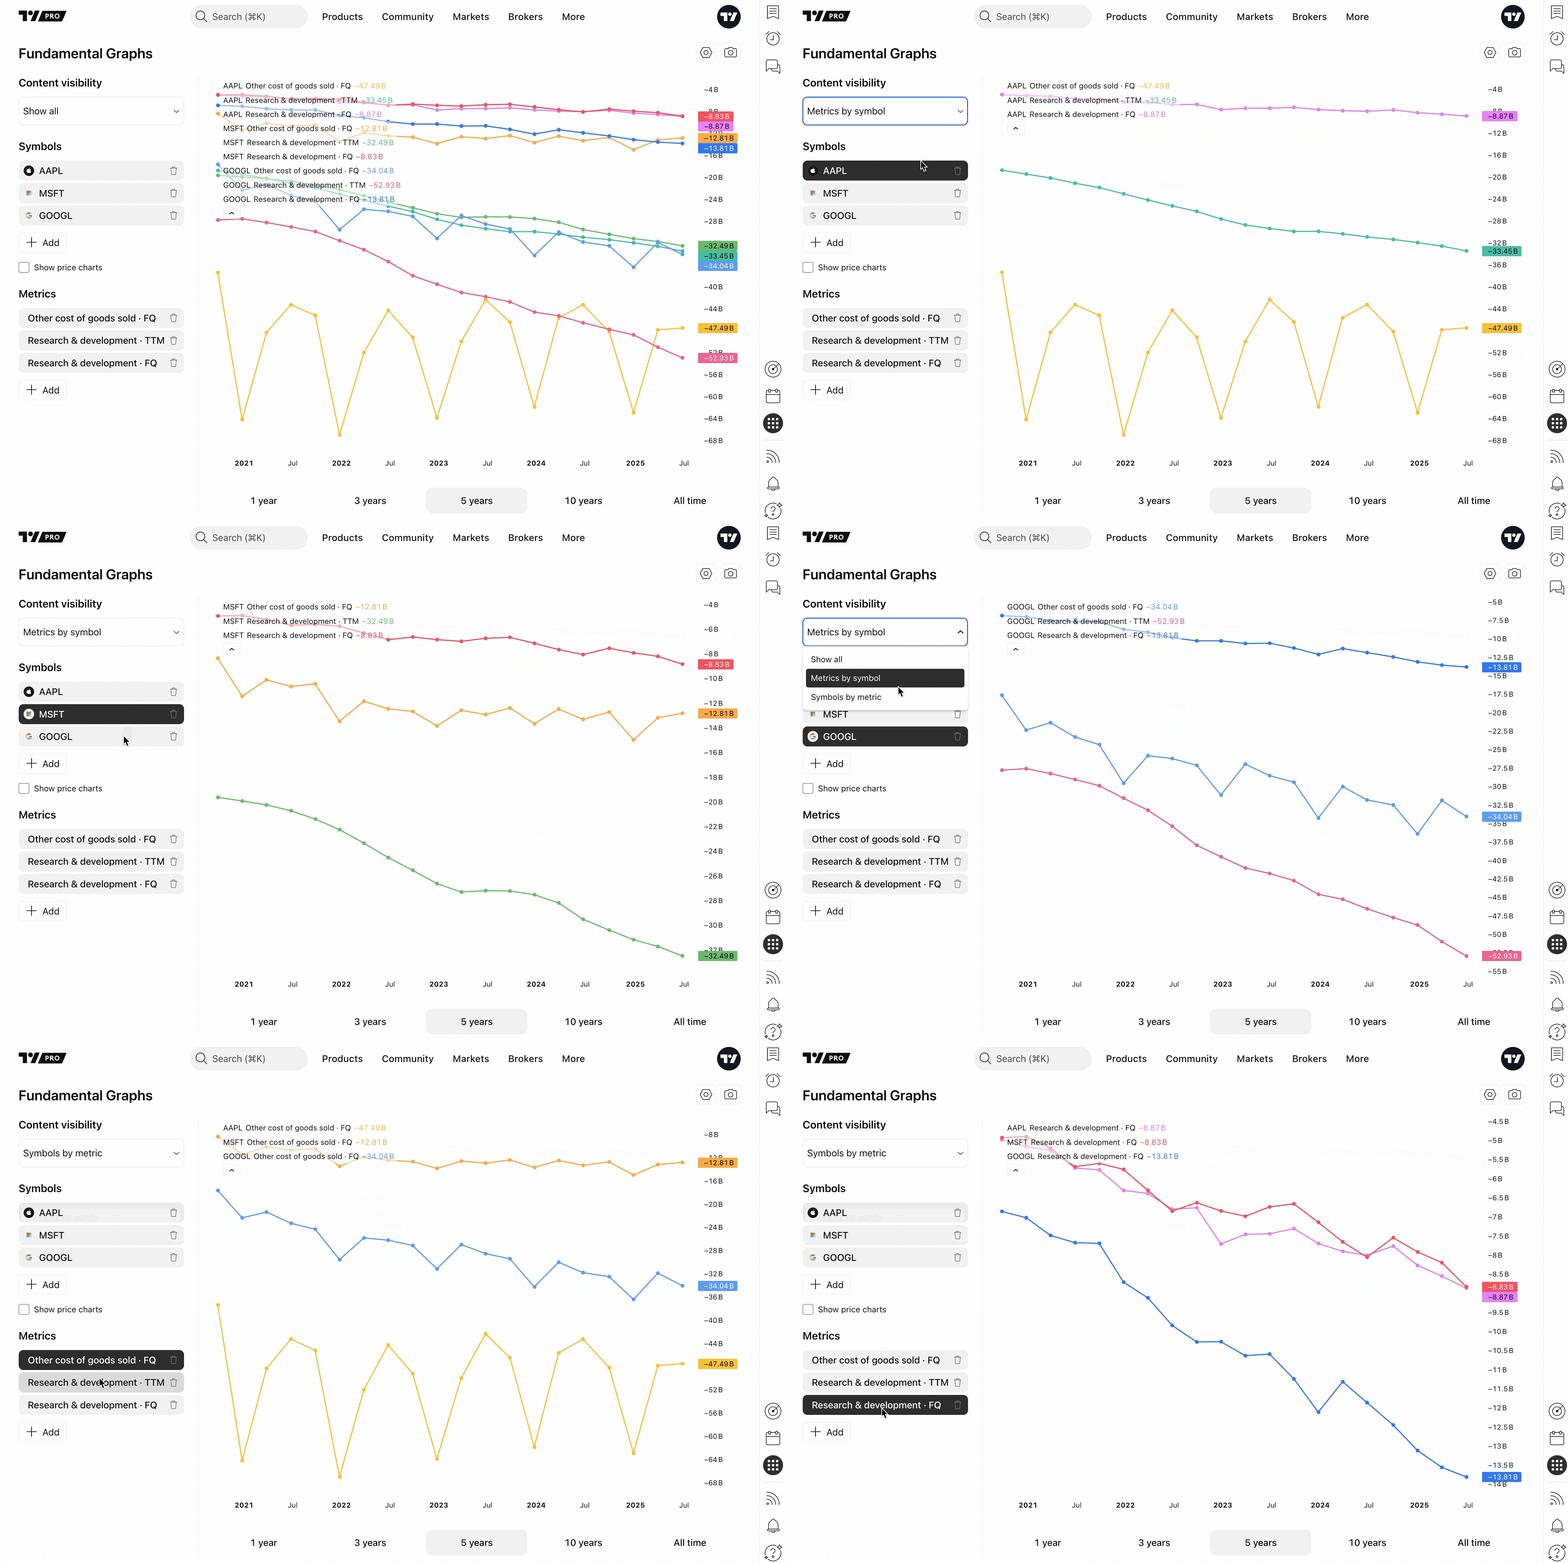
You can also explore several visibility modes, allowing you to tailor the chart to your analysis style:
- Show all: Displays every metric for every selected symbol
- Metrics by symbol: Focus on all metrics for one active symbol you selected in the left panel
- Symbols by metric: Compare how each symbol performs for a single selected metric

Adjustable date and scale
The chart also allows you to choose your preferred date range and scale type — including regular, logarithmic, percentage, or indexed to 100 — to fit your analysis.
The date can be adjusted with the buttons under the chart.

Looking for scale mode? Head for the settings button at the chart’s upper right corner.

Graphs sharing
Every chart configuration is automatically saved to a unique URL, making it easy to share with colleagues or clients.
You can also take snapshots and save or share them instantly – simply find the snapshot button above the chart.

Why use Fundamental Graphs
This tool delivers new analysis opportunities for traders and investors who rely on core business data to validate trades or shape long-term strategies. By offering a visual, comparative look at financial performance, our graphs help you save time and navigate global stock markets with more confidence.
For example, if you want to evaluate several tech stocks, you can quickly compare their revenue growth, profit, and R&D spending trends over time — all in one chart — to see which companies are scaling efficiently and whose finances are stagnating. This way, you can make a decision backed by data, not just price action.
We hope this long-awaited functionality will come in handy in your workflow. Keep sending us your feedback — it helps us to improve and innovate the platform.
Team TradingView
