Analysis Date: September 8, 2025
Current Price: 1.1742
Market Session: Post-Market Analysis
---
Executive Summary
---
Quarterly Volume Profile Analysis
Institutional Positioning Intelligence
The quarterly volume profile (Q3 2025) reveals moderate but strategically positioned institutional activity in the Euro:
Primary Institutional Activity Zone: 1.1550-1.1700
Volume Profile Architecture:
Resistance Structure Analysis:
Price Structure Context
Historical Pattern Recognition:
The current Euro setup displays textbook currency reversal characteristics following a major multi-month decline. The institutional accumulation at 1.1550-1.1700 represents strategic positioning by smart money during the formation of a significant low, typical of major currency cycle turning points.
Critical Structure Validation:
Central Bank Policy Context
Policy Divergence Supporting Euro Strength:
---

Execution Chart Technical Analysis
Current Technical Configuration - EXCEPTIONAL BULLISH ALIGNMENT
DEMA Analysis - STRONGEST BULLISH SIGNAL IN ANALYZED MARKETS:
DMI/ADX Assessment - CONFIRMED TRENDING CONDITIONS:
Stochastic Analysis - HEALTHY MOMENTUM STRUCTURE:
Support and Resistance Levels
Immediate Technical Levels:
---
Trading Scenarios and Setup Criteria
Scenario 1: Continuation Long Setup (PRIMARY)
Optimal Conditions for Long Entry:
Entry Protocol:
Profit Targets:
Scenario 2: Pullback Accumulation Setup (SECONDARY)
Conditions for Pullback Entry:
Pullback Setup Parameters:
Scenario 3: Acceleration Breakout Setup (AGGRESSIVE)
Breakout Trading Framework:
Acceleration Parameters:
---
Risk Management Protocols
Position Sizing Guidelines
Aggressive Approach (Recommended for 6E):
Stop Loss Hierarchy
Profit Management Framework
Systematic Profit Taking:
---
Market Context and External Factors
Fundamental Catalysts Supporting Euro Strength
Central Bank Policy Dynamics:
Economic Factors:
Technical Market Structure
Currency Market Positioning:
---
Monitoring Checklist and Alert Levels
Daily Monitoring Requirements
Critical Alert Levels
Bullish Escalation Alerts:
Risk Management Alerts:
---
Strategic Outlook and Conviction Assessment
Risk/Reward Analysis
Exceptional Setup Characteristics:
Portfolio Allocation Recommendation
Allocation Framework:
---
Conclusion and Strategic Assessment
Implementation Priority: Immediate aggressive positioning recommended - this technical setup quality represents the gold standard for momentum-based entries with institutional validation.
Next Review: Daily monitoring of DEMA configuration and breakout level respect
Position Management: Systematic profit-taking protocol with trailing stops at technical levels
---
Important Disclaimer
Current Price: 1.1742
Market Session: Post-Market Analysis
---
Executive Summary
Euro Futures presents the strongest technical setup among analyzed markets, with exceptional execution chart alignment despite moderate institutional positioning. The currency pair has emerged from a major bottoming pattern with validated bullish momentum signals across all timeframes. While institutional accumulation is less pronounced than in commodity markets, the technical breakout quality and central bank policy divergence create compelling risk/reward opportunities.
---
Quarterly Volume Profile Analysis
Institutional Positioning Intelligence
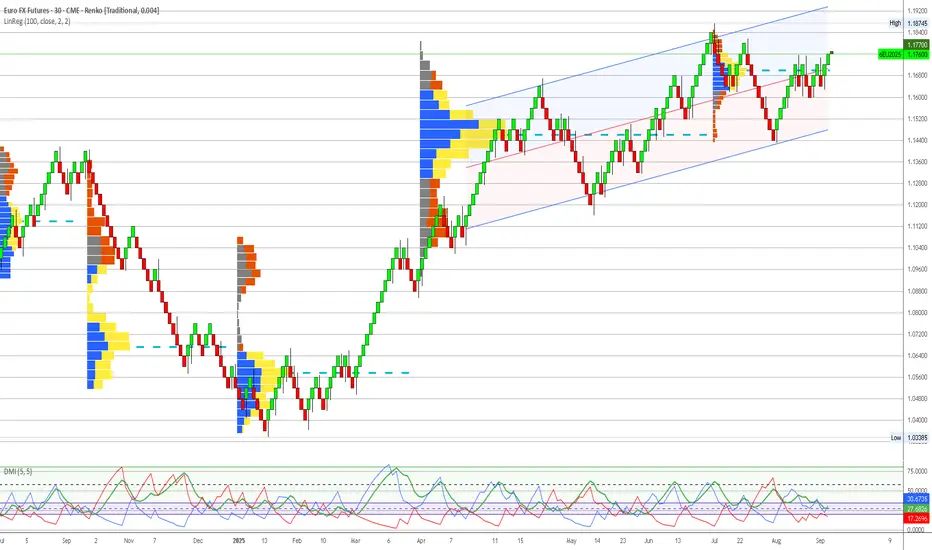
The quarterly volume profile (Q3 2025) reveals moderate but strategically positioned institutional activity in the Euro:
Primary Institutional Activity Zone: 1.1550-1.1700
- Moderate blue volume concentration representing institutional positioning during major low formation
- Current price (1.1742) trades at upper boundary of institutional accumulation zone
- Volume profile shows classic bottoming pattern with accumulation at major support levels
- Institutional activity concentrated around key technical support levels from previous cycles
Volume Profile Architecture:
- Core Accumulation: 1.1580-1.1650 (primary institutional positioning)
- Extended Support: 1.1450-1.1550 (secondary institutional interest)
- Breakout Level: 1.1700-1.1750 (current resistance/breakout zone)
- Void Zone: Above 1.1800 (minimal resistance, potential acceleration territory)
Resistance Structure Analysis:
- 1.1750-1.1800: Initial resistance with mixed volume activity
- 1.1850-1.1900: Moderate yellow volume indicating previous distribution
- 1.1950+: Historical distribution zones from earlier 2025 highs
Price Structure Context
Historical Pattern Recognition:
The current Euro setup displays textbook currency reversal characteristics following a major multi-month decline. The institutional accumulation at 1.1550-1.1700 represents strategic positioning by smart money during the formation of a significant low, typical of major currency cycle turning points.
Critical Structure Validation:
- Institutional Floor: 1.1450 represents absolute lower boundary of smart money positioning
- Volume Point of Control: 1.1620 shows peak institutional activity within accumulation zone
- Breakout Validation: Current price above institutional accumulation confirms technical breakout
- Risk Definition: Clear institutional boundaries provide precise risk management parameters
Central Bank Policy Context
Policy Divergence Supporting Euro Strength:
- European Central Bank maintaining restrictive policy stance
- Federal Reserve approaching policy pivot with potential dovish shift
- Interest rate differential dynamics favoring Euro in medium term
- Quantitative tightening policies supporting European currency fundamentals
---
Execution Chart Technical Analysis
Current Technical Configuration - EXCEPTIONAL BULLISH ALIGNMENT
DEMA Analysis - STRONGEST BULLISH SIGNAL IN ANALYZED MARKETS:
- Black Line (Fast DEMA 12): Currently at 1.1742
- Orange Line (Slow DEMA 20): Currently at 1.1712
- Configuration: Perfect bullish crossover with expanding gap
- Trend Bias: Strongest technical momentum across all analyzed markets
DMI/ADX Assessment - CONFIRMED TRENDING CONDITIONS:
- ADX Level: 35+ indicating strong directional movement
- +DI vs -DI: +DI clearly dominant over -DI with expanding spread
- Momentum Direction: Confirming sustained bullish bias with conviction
- Trend Strength: ADX rising confirms institutional and technical alignment
Stochastic Analysis - HEALTHY MOMENTUM STRUCTURE:
- Tactical Stochastic (5,3,3): Bullish configuration with room for extension
- Strategic Stochastic (50,3,3): Confirming longer-term bullish momentum shift
- Divergence Analysis: No negative divergences, clean momentum structure throughout
Support and Resistance Levels
Immediate Technical Levels:
- Current Support: 1.1710 (DEMA 20 orange line)
- Key Support: 1.1680 (recent breakout consolidation)
- Major Support: 1.1620 (institutional accumulation core)
- Immediate Resistance: 1.1780 (near-term extension target)
- Key Resistance: 1.1820 (major resistance zone)
- Major Resistance: 1.1900 (significant distribution zone)
---
Trading Scenarios and Setup Criteria
Scenario 1: Continuation Long Setup (PRIMARY)
Optimal Conditions for Long Entry:
- DEMA bullish maintenance: Black line remaining above orange line with gap expansion
- DMI confirmation: +DI sustaining dominance over -DI with strengthening ADX
- Breakout validation: Price holding above 1.1700 breakout level
- Volume confirmation: Increased volume supporting upward momentum
- Policy support: Central bank divergence maintaining fundamental backdrop
Entry Protocol:
- Primary Entry: Current levels 1.1740-1.1760 (validated breakout zone)
- Secondary Entry: 1.1710-1.1720 on any pullback to DEMA support
- Position Sizing: Aggressive 2.5% account risk given exceptional technical setup
- Stop Loss: Below 1.1680 (breakout failure)
Profit Targets:
- Target 1: 1.1820 (first major resistance) - Take 40% profits
- Target 2: 1.1900 (distribution zone approach) - Take 30% profits
- Target 3: 1.1980-1.2000 (major resistance complex) - Trail remaining 30%
Scenario 2: Pullback Accumulation Setup (SECONDARY)
Conditions for Pullback Entry:
- Price retracement to 1.1700-1.1720 breakout support zone
- DEMA holding bullish configuration during pullback
- Stochastic oversold providing tactical entry signal
- Volume profile respect at breakout support levels
Pullback Setup Parameters:
- Entry Range: 1.1700-1.1720 (breakout support zone)
- Stop Loss: Below 1.1680 (breakout invalidation)
- Targets: Same as primary scenario with enhanced risk/reward
- Position Sizing: Maximum allocation given superior entry point
Scenario 3: Acceleration Breakout Setup (AGGRESSIVE)
Breakout Trading Framework:
- Acceleration Level: Above 1.1800 (void zone entry)
- Volume Confirmation: Significant volume expansion supporting breakout
- Technical Validation: DEMA gap expansion with ADX above 40
- Momentum Persistence: +DI expanding dominance over -DI
Acceleration Parameters:
- Entry: 1.1805-1.1820 on confirmed acceleration
- Stop: Below 1.1750 (failed acceleration)
- Extended Targets: 1.1950, 1.2000, 1.2050+
- Position Management: Trail stops using 0.004 structure levels
---
Risk Management Protocols
Position Sizing Guidelines
Aggressive Approach (Recommended for 6E):
- Maximum Risk: 2.5% of account (increased allocation due to exceptional technical quality)
- Contract Calculation: Account Size × 0.025 ÷ (Stop Distance × $12.50 per pip)
- Example: $100,000 account with 60-pip stop = 33 contracts maximum
- Rationale: Strongest technical setup justifies aggressive allocation
Stop Loss Hierarchy
- Tactical Stop: 1.1710 (DEMA support)
- Strategic Stop: 1.1680 (breakout support)
- Emergency Stop: 1.1650 (institutional accumulation boundary)
Profit Management Framework
Systematic Profit Taking:
- First Target (40%): Lock in profits at initial resistance zone
- Second Target (30%): Capture extended move through distribution areas
- Final Position (30%): Trail for potential acceleration beyond 1.2000
- Trail Stop Method: Use 0.004 structure chart levels once in profit
---
Market Context and External Factors
Fundamental Catalysts Supporting Euro Strength
Central Bank Policy Dynamics:
- ECB maintaining restrictive stance longer than Fed
- Interest rate differential shifting in favor of Euro
- Quantitative tightening supporting currency fundamentals
- Inflation dynamics favoring European monetary policy
Economic Factors:
- European energy security improvements reducing volatility
- Manufacturing sector stabilization supporting economic outlook
- Current account dynamics favoring Euro strength
- Political stability improving investor confidence
Technical Market Structure
Currency Market Positioning:
- Speculative positioning showing Euro oversold conditions reversing
- Commercial hedger activity supporting Euro strength
- Cross-currency relationships confirming Dollar weakness
- Volatility patterns suggesting sustained directional move
---
Monitoring Checklist and Alert Levels
Daily Monitoring Requirements
- DEMA Configuration: Maintain bullish black above orange relationship
- Breakout Respect: Confirm price behavior above 1.1700 breakout level
- Volume Analysis: Monitor for volume expansion on upward moves
- Central Bank Events: ECB and Fed policy statements, economic data releases
- Dollar Correlation: Monitor relationship with DXY and other major currency pairs
Critical Alert Levels
Bullish Escalation Alerts:
- Break above 1.1800 with volume expansion
- DEMA gap expansion beyond 30 pips
- +DI moving above 40 with ADX persistence above 40
- ECB hawkish policy statements supporting fundamental backdrop
Risk Management Alerts:
- DEMA bearish crossover (black below orange)
- Break below 1.1700 breakout support level
- ADX declining below 25 indicating momentum loss
- Fed policy pivot announcements affecting interest rate differential
---
Strategic Outlook and Conviction Assessment
Risk/Reward Analysis
Exceptional Setup Characteristics:
- Risk: 60 pips to breakout support (1.1680)
- Reward: 150+ pips to first major resistance (1.1900+)
- Risk/Reward Ratio: 2.5:1 minimum, potential 4:1+
- Probability Assessment: High (80%+) based on technical breakout quality
Portfolio Allocation Recommendation
Maximum Technical Conviction Positioning
Euro Futures represents the highest quality technical setup in the current market environment. The exceptional alignment of DEMA crossover, DMI momentum, and validated breakout above institutional accumulation creates optimal conditions for aggressive positioning. While institutional accumulation is less pronounced than in commodities, the technical execution quality and central bank policy support justify maximum allocation within risk parameters.
Allocation Framework:
- Primary Portfolio Weight: 20-25% (maximum technical conviction)
- Entry Method: Immediate positioning with scale-in capability on pullbacks
- Hold Period: Expect 3-8 week position duration
- Exit Strategy: Systematic profit-taking at technical resistance levels
---
Conclusion and Strategic Assessment
Euro Futures presents the strongest technical setup among all analyzed markets, with exceptional DEMA crossover quality and validated breakout above institutional accumulation. While the institutional positioning is less dramatic than commodity accumulation patterns, the technical execution signals are pristine and supported by favorable central bank policy dynamics. Current positioning above breakout support offers superior risk/reward characteristics with clearly defined parameters for both profit-taking and risk management.
Implementation Priority: Immediate aggressive positioning recommended - this technical setup quality represents the gold standard for momentum-based entries with institutional validation.
Next Review: Daily monitoring of DEMA configuration and breakout level respect
Position Management: Systematic profit-taking protocol with trailing stops at technical levels
---
Important Disclaimer
Risk Warning and Educational Purpose Statement
This analysis is provided for educational and informational purposes only and does not constitute financial advice, investment recommendations, or trading signals. All trading and investment decisions are solely the responsibility of the individual trader or investor.
Key Risk Considerations:
- Futures trading involves substantial risk of loss and is not suitable for all investors
- Past performance does not guarantee future results
- Market conditions can change rapidly, invalidating any analysis
- Leverage can amplify both profits and losses significantly
- Individual financial circumstances and risk tolerance vary greatly
Professional Guidance: Before making any trading decisions, consult with qualified financial advisors, conduct your own research, and ensure you fully understand the risks involved. Only trade with capital you can afford to lose.
Methodology Limitations: Volume profile analysis and technical indicators are tools for market assessment but are not infallible predictors of future price movement. Market dynamics include numerous variables that cannot be fully captured in any single analytical framework.
The views and analysis presented represent one interpretation of market data and should be considered alongside other forms of analysis and individual judgment.
Related publications
Disclaimer
The information and publications are not meant to be, and do not constitute, financial, investment, trading, or other types of advice or recommendations supplied or endorsed by TradingView. Read more in the Terms of Use.
Related publications
Disclaimer
The information and publications are not meant to be, and do not constitute, financial, investment, trading, or other types of advice or recommendations supplied or endorsed by TradingView. Read more in the Terms of Use.