A look at the component charts lines up very cleanly with the broader QQQ direction into 2026
1. Clear leadership split or still acting well/potential leaders
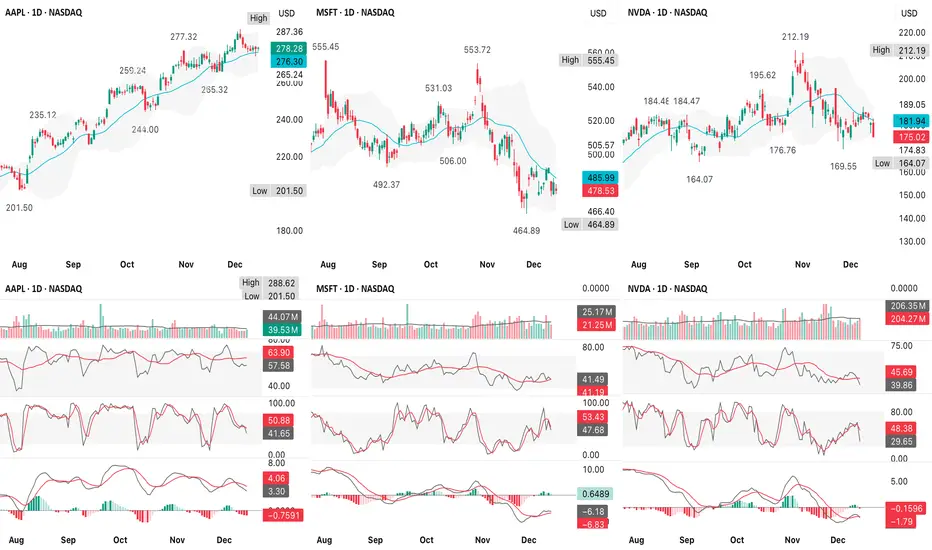
AAPL
GOOGL
TSLA

2. Neutral/repair mode
AMZN
META

3. Clear weak links
NVDA
MSFT
AVGO
NFLX

Breadth signals suggest that this is not a panic tape
This implies for QQQ that the most probable path (highest odds) is a bounce first, then decision
A lower-probability, but valid alternative is if NVDA loses its recent lows decisively & AAPL breaks its rising MA
Forget narratives - these are the objective tells
1. Does NVDA fail another bounce under its 20-50d MA?
2. Does AAPL hold its rising MA on any dip?
3. Does TSLA continue to make higher lows?
4. Does AVGO stabilize instead of cascading?
This looks like a rotation-driven reset, not a market that’s done yet, but also not one about to collapse
Market wants to rally, but breadth is questionable & that regime typically resolves 1 of 2 ways
If you get 3+ of these, odds tilt toward Santa succeeding even with semis weak & QQQ holds the prior swing low on the daily (no lower-low close)
If instead you get QQQ makes a lower-low close, AAPL breaks trend & fails the reclaim within 1-2 sessions & semis keep making fresh lows, then the “bounce to ~$620-$625 fade” becomes the base case & $590s stays in play
23-27 December tells of what a failed Santa attempt looks like - this is the “looks fine… until it doesn’t” pattern
The 3 “reset is done” triggers that I actually use
 QQQ
QQQ  AAPL
AAPL  AMZN
AMZN  AVGO
AVGO  GOOGL
GOOGL  META
META  MSFT
MSFT  NFLX
NFLX  NVDA
NVDA  TSLA
TSLA
I am deliberately skeptical & weighting what usually leads, not what feels bullish/bearish emotionally
1. Clear leadership split or still acting well/potential leaders
AAPL
- Above rising short-term MA, shallow pullback, no real momentum damage
- RSI mid–upper range, MACD only mildly negative
- This is not distribution behavior
GOOGL
- Trend intact, pullback to rising MA, RSI still elevated
- Looks like digestion, not a trend break
TSLA
- Relative strength standout
- Higher lows, bullish stochastic reset, MACD turning up
- This is classic “risk appetite not gone” behavior
These names usually don’t hold up if a real index leg down is imminent
2. Neutral/repair mode
AMZN
- Choppy range, sitting near mid-range support
- Momentum soft, but not breaking down
META
- Sharp correction already occurred
- Now basing above recent lows; momentum trying to stabilize
- Damage done, but selling pressure clearly slowing
These look more like already paid the price, not just starting to fall
3. Clear weak links
NVDA
- Lower highs, weak bounce attempts, RSI sub-50
- This is the most important chart psychologically
MSFT
- Clean breakdown from November high
- Momentum still negative, rallies sold
AVGO
- Earnings gap down with volume
- This is real distribution, not noise
NFLX
- Continued downtrend, no strong reclaim yet
These are dragging QQQ, but note that most of this damage is already visible, not hidden
Breadth signals suggest that this is not a panic tape
- Across almost all charts RSI mostly 40-55, not 30s, stochastics cycling, not pinned & MACD negative but flattening, not accelerating, so this is controlled rotation, not liquidation
- If this were setting up a fast move to QQQ ~$590 immediately, you’d expect more RSIs < 35, more impulsive downside candles, & failed bounces across all mega-cap leaders
This implies for QQQ that the most probable path (highest odds) is a bounce first, then decision
- Weak semis + MSFT = cap on upside
- AAPL/GOOGL/TSLA = downside protection
- That argues for a reflex rally (likely into $620-$625 area on QQQ)
- Followed by stall/compression, not instant ATHs
- Then a test of either higher low → Santa continuation or rollover to the $590s later
A lower-probability, but valid alternative is if NVDA loses its recent lows decisively & AAPL breaks its rising MA
- Then the market probably hasn’t finished the reset
- That’s when the $590s become much more likely
- Right now, that confirmation is not present
Forget narratives - these are the objective tells
1. Does NVDA fail another bounce under its 20-50d MA?
- If yes → drag continues
2. Does AAPL hold its rising MA on any dip?
- If yes → index downside limited
3. Does TSLA continue to make higher lows?
- Risk appetite intact if it does
4. Does AVGO stabilize instead of cascading?
- Big for semis sentiment
- If 2 of those 4 fail simultaneously, odds shift toward deeper downside
- If 3 of 4 hold, Santa odds rise materially
This looks like a rotation-driven reset, not a market that’s done yet, but also not one about to collapse
- A bounce into mid/late December is the statistically cleaner path from these charts
- The real question is whether that bounce builds structure or fails quickly
Market wants to rally, but breadth is questionable & that regime typically resolves 1 of 2 ways
- “Rotation Santa” (index grinds up even as laggards stay laggards)
- “Breadth rug pull” (leaders finally roll & index drops fast)
If you get 3+ of these, odds tilt toward Santa succeeding even with semis weak & QQQ holds the prior swing low on the daily (no lower-low close)
- AAPL/GOOGL remain above their rising short-term trend (20ish day look)
- VIX is not making higher highs during down days (complacency returning)
- Down days are smaller-range than the earlier selloff (volatility compression)
- New lows list is not expanding while price chops (internal stabilization)
If instead you get QQQ makes a lower-low close, AAPL breaks trend & fails the reclaim within 1-2 sessions & semis keep making fresh lows, then the “bounce to ~$620-$625 fade” becomes the base case & $590s stays in play
- You’re looking for structure + absorption, not fireworks into 23-27 December
- Higher low(s) on the 1H/4H while daily holds support
- Inside-day or breakout (tight range resolves up)
- Closes near the high of day on at least 2 of those sessions
- Up days on average/low volume is fine (holiday), but down days must be low volume too (no distribution)
- Leadership breadth improves slightly & you don’t need semis to lead, you just need fewer new breakdowns
- RSI on QQQ stabilizes above ~45-50 & slopes up
- MACD histogram stops getting more negative (flattening is enough)
- If you see that, the “Santa can start” signal is basically reset done = volatility compresses + leaders stop breaking + QQQ holds the low
23-27 December tells of what a failed Santa attempt looks like - this is the “looks fine… until it doesn’t” pattern
- Gap up/early strength gets sold & closes mid-to-low range (2+ times)
- Failure at a key reclaim level (prior breakdown level or VWAP zone) within 24-48 hours
- One big trend day down that breaks the range (holiday weeks hate that & if it happens, it’s meaningful)
- Semis continue to make new lows & it starts pulling down the “strong ones” (AAPL breaks trend, GOOGL loses MA, etc)
- Breadth worsens while index is flat/up (classic divergence)
- If that happens, the most common path is quick rejection from the bounce zone (~$620-$625 area), then a liquidation leg toward the next major support (~$590)
The 3 “reset is done” triggers that I actually use
- QQQ higher low + reclaim of the prior day’s VWAP/anchored VWAP
- AAPL doesn't lose its rising trend on a closing basis (or loses/reclaims within 1 day)
- NVDA stops making lower lows (it can stay weak, but it just can’t keep accelerating down)
I am not a licensed professional & these posts are for informational purposes only, not financial advice. Follow if it adds value — pakoumal.substack.com.
Disclaimer
The information and publications are not meant to be, and do not constitute, financial, investment, trading, or other types of advice or recommendations supplied or endorsed by TradingView. Read more in the Terms of Use.