📊 1-Hour Timeframe Technical Overview
Current Price: ₹1,392.00
Day’s Range: ₹1,390.30 – ₹1,416.70
Volume: ~1.9 million shares
Price Change: -1.08%
Technical Strength Index: Mild Bearish
📈 Key Indicators
Supertrend: 1460.9 (Mild Bearish)
Parabolic SAR: 1458.77 (Mild Bearish)
RSI (Relative Strength Index): Data not specified
MACD: Data not specified
ADX (Average Directional Index): Data not specified
Stochastic Oscillator: Data not specified
Rate of Change (ROC): Data not specified
Chaikin Money Flow (CMF): -0.05 (Bearish)
Williams %R: Data not specified
Pivot Levels: Data not specified
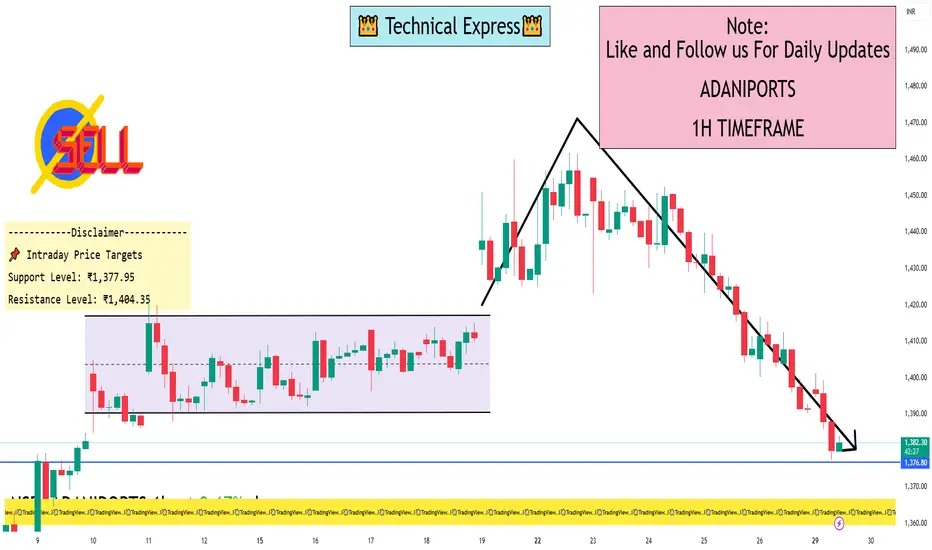
📌 Intraday Price Targets
Support Level: ₹1,377.95
Resistance Level: ₹1,404.35
🔍 Summary
Adani Ports is currently exhibiting a mild bearish trend on the 1-hour chart, with key indicators such as the Supertrend and Parabolic SAR suggesting downward momentum. The Chaikin Money Flow (CMF) is also negative, indicating potential selling pressure.
Intraday traders should monitor the support level at ₹1,377.95 and the resistance at ₹1,404.35. A break below support could signal further downside, while a move above resistance may indicate a reversal or continuation of the uptrend.
Please note that technical analysis is subject to market conditions and should be used in conjunction with other forms of analysis and risk management strategies.
Current Price: ₹1,392.00
Day’s Range: ₹1,390.30 – ₹1,416.70
Volume: ~1.9 million shares
Price Change: -1.08%
Technical Strength Index: Mild Bearish
📈 Key Indicators
Supertrend: 1460.9 (Mild Bearish)
Parabolic SAR: 1458.77 (Mild Bearish)
RSI (Relative Strength Index): Data not specified
MACD: Data not specified
ADX (Average Directional Index): Data not specified
Stochastic Oscillator: Data not specified
Rate of Change (ROC): Data not specified
Chaikin Money Flow (CMF): -0.05 (Bearish)
Williams %R: Data not specified
Pivot Levels: Data not specified
📌 Intraday Price Targets
Support Level: ₹1,377.95
Resistance Level: ₹1,404.35
🔍 Summary
Adani Ports is currently exhibiting a mild bearish trend on the 1-hour chart, with key indicators such as the Supertrend and Parabolic SAR suggesting downward momentum. The Chaikin Money Flow (CMF) is also negative, indicating potential selling pressure.
Intraday traders should monitor the support level at ₹1,377.95 and the resistance at ₹1,404.35. A break below support could signal further downside, while a move above resistance may indicate a reversal or continuation of the uptrend.
Please note that technical analysis is subject to market conditions and should be used in conjunction with other forms of analysis and risk management strategies.
I built a Buy & Sell Signal Indicator with 85% accuracy.
📈 Get access via DM or
WhatsApp: wa.link/d997q0
| Email: techncialexpress@gmail.com
| Script Coder | Trader | Investor | From India
📈 Get access via DM or
WhatsApp: wa.link/d997q0
| Email: techncialexpress@gmail.com
| Script Coder | Trader | Investor | From India
Related publications
Disclaimer
The information and publications are not meant to be, and do not constitute, financial, investment, trading, or other types of advice or recommendations supplied or endorsed by TradingView. Read more in the Terms of Use.