10/20/25 - $anf - huh? toe'ing in again... 10/20/25 :: VROCKSTAR :: NYSE:ANF
huh? toe'ing in again...
- if there's one theme this year, outside of the "obvious" chip-AI trades
- it's "nothing makes sense and active investing is dead"
- norms willing to pay 10s of billions for presentations about science projects
- and meanwhile, i'll be
Next report date
—
Report period
—
EPS estimate
—
Revenue estimate
—
9.57 EUR
546.67 M EUR
4.78 B EUR
46.05 M
About Abercrombie & Fitch Company
Sector
Industry
CEO
Fran Horowitz-Bonadies
Website
Headquarters
New Albany
Founded
1892
ISIN
US0028962076
FIGI
BBG00FGWY8V9
Abercrombie & Fitch Co. engages in the retail of apparel, personal care products, and accessories. The firm operates through following geographical segments: Americas, EMEA and APAC. The Americas segment includes operations in North America and South America. The EMEA segment includes operations in Europe, the Middle East and Africa. The APAC segment includes operations in the Asia-Pacific region, including Asia and Oceania. The company was founded by David Abercrombie in 1892 and is headquartered in New Albany, OH.
Related stocks

ANF at multi year support I think considering strong financials and Low PE ANF can be a good buy. Shaded area looks good buy zone for me i bought myself some today and will add if drops below 70
Disclaimer: I am not financial advisor a practicing doctor and just a small retail investor

ANF I think very undervalued here at this price . will be steal below 70 . good EPS growth in last 3 years . CFRA gave 5 star rating for strong buy. ROA/ROE/ROCE all top of the sector
i think will give good return
Hold Period 1- 3 years

ANF watch $103: Proven Resistance zone holding up next major legANF trying to paint a bottom after a downtrend.
Now testing a proven Resistance $103.14-103.97
Look for a Break-n-Retest, dips not interesting

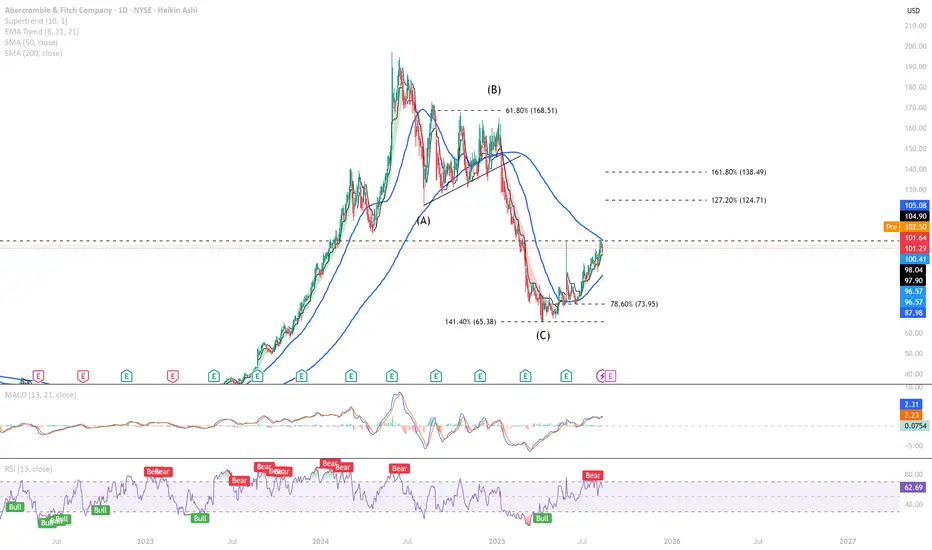
Setting the Stage for Institutional Buying!Abercrombie & Fitch Fierce has experienced a sharp downtrend for the past year, characterized by A-B-C impulsive corrective waves.
For sustained upward movement, I want to see the price close above the DSMA200 level—currently around $105—for at least 2–3 days.
The company’s fair value is estimated
ANF - Short term upside NYSE:ANF is looking at a short term upside after the large bearish candle seen rejecting at 50% Fib retracement level fails to create a new low below 76 psychological level.
Currently, ANF is on the early uptrend and ichimoku shows a relative bullish signal after a bullish marobozu was seen closi

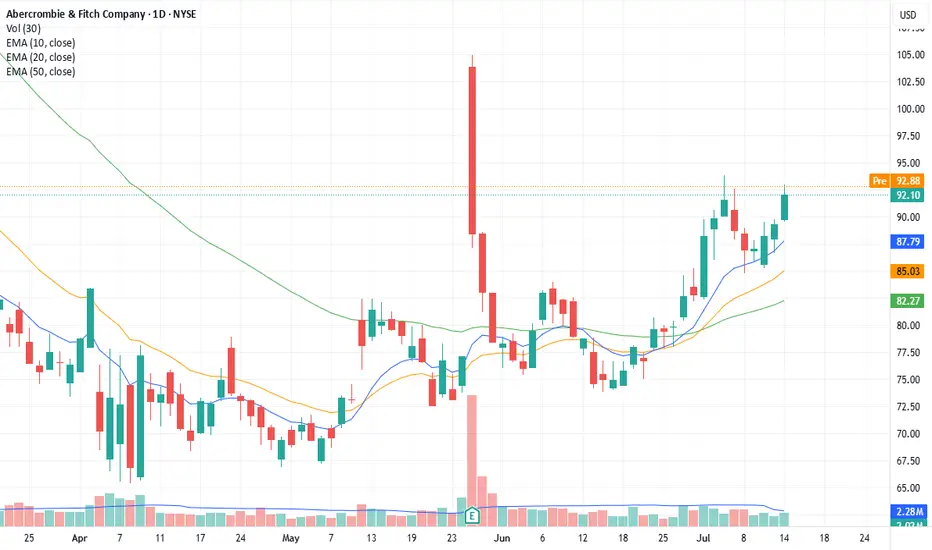
ANF break out1) uptrend since mid june
2) drying of volumes
3) breaking through the $92.10 line
4) entry $92, stop loss at $89.50
ANF | Direction: Long | Retail Resilience | (June 23, 2025)ANF | Direction: Long | Key Reason: Brand Recovery & Retail Resilience | (June 23, 2025)
1️⃣ Insight Summary
Abercrombie & Fitch is showing signs of a longer-term brand turnaround. Despite recent earnings disappointment, its historic strength, broad international footprint, and stable balance sheet

6/6/25 - $anf - Upgrading this to a buy ~$806/6/25 :: VROCKSTAR :: NYSE:ANF
Upgrading this to a buy ~$80
- low teens fcf yield
- single digit PE
- brand healthy and growing
- stock beat/ stock ripped
- company buying back shares
- when i compare to something like $lulu... i think... this name is already priced for recession and anything lo

ANF | Long Setup | Strong Fundamentals | (May 2025)ANF | Long Setup | Strong Fundamentals + Earnings Momentum | (May 2025)
1️⃣ Short Insight Summary:
Abercrombie & Fitch (ANF) shows solid financial strength with consistent growth outlook. Current valuation is attractive with potential upside toward key resistance levels.
2️⃣ Trade Parameters:
Bias

See all ideas
Summarizing what the indicators are suggesting.
Neutral
SellBuy
Strong sellStrong buy
Strong sellSellNeutralBuyStrong buy
Neutral
SellBuy
Strong sellStrong buy
Strong sellSellNeutralBuyStrong buy
Neutral
SellBuy
Strong sellStrong buy
Strong sellSellNeutralBuyStrong buy
An aggregate view of professional's ratings.
Neutral
SellBuy
Strong sellStrong buy
Strong sellSellNeutralBuyStrong buy
Neutral
SellBuy
Strong sellStrong buy
Strong sellSellNeutralBuyStrong buy
Neutral
SellBuy
Strong sellStrong buy
Strong sellSellNeutralBuyStrong buy
Displays a symbol's price movements over previous years to identify recurring trends.
Curated watchlists where AFT is featured.

Frequently Asked Questions
The current price of AFT is 64.27 EUR — it has increased by 0.41% in the past 24 hours. Watch Abercrombie & Fitch Co. Class A stock price performance more closely on the chart.
Depending on the exchange, the stock ticker may vary. For instance, on GETTEX exchange Abercrombie & Fitch Co. Class A stocks are traded under the ticker AFT.
AFT stock has risen by 12.19% compared to the previous week, the month change is a −14.52% fall, over the last year Abercrombie & Fitch Co. Class A has showed a −51.23% decrease.
We've gathered analysts' opinions on Abercrombie & Fitch Co. Class A future price: according to them, AFT price has a max estimate of 111.81 EUR and a min estimate of 72.25 EUR. Watch AFT chart and read a more detailed Abercrombie & Fitch Co. Class A stock forecast: see what analysts think of Abercrombie & Fitch Co. Class A and suggest that you do with its stocks.
AFT stock is 3.00% volatile and has beta coefficient of 0.95. Track Abercrombie & Fitch Co. Class A stock price on the chart and check out the list of the most volatile stocks — is Abercrombie & Fitch Co. Class A there?
Today Abercrombie & Fitch Co. Class A has the market capitalization of 2.99 B, it has decreased by −2.57% over the last week.
Yes, you can track Abercrombie & Fitch Co. Class A financials in yearly and quarterly reports right on TradingView.
Abercrombie & Fitch Co. Class A is going to release the next earnings report on Nov 25, 2025. Keep track of upcoming events with our Earnings Calendar.
AFT earnings for the last quarter are 2.03 EUR per share, whereas the estimation was 2.02 EUR resulting in a 0.67% surprise. The estimated earnings for the next quarter are 1.91 EUR per share. See more details about Abercrombie & Fitch Co. Class A earnings.
Abercrombie & Fitch Co. Class A revenue for the last quarter amounts to 1.06 B EUR, despite the estimated figure of 1.05 B EUR. In the next quarter, revenue is expected to reach 1.10 B EUR.
AFT net income for the last quarter is 123.85 M EUR, while the quarter before that showed 71.00 M EUR of net income which accounts for 74.42% change. Track more Abercrombie & Fitch Co. Class A financial stats to get the full picture.
Abercrombie & Fitch Co. Class A dividend yield was 0.00% in 2024, and payout ratio reached 0.00%. The year before the numbers were 0.00% and 0.00% correspondingly. See high-dividend stocks and find more opportunities for your portfolio.
As of Oct 29, 2025, the company has 39.2 K employees. See our rating of the largest employees — is Abercrombie & Fitch Co. Class A on this list?
EBITDA measures a company's operating performance, its growth signifies an improvement in the efficiency of a company. Abercrombie & Fitch Co. Class A EBITDA is 782.56 M EUR, and current EBITDA margin is 17.90%. See more stats in Abercrombie & Fitch Co. Class A financial statements.
Like other stocks, AFT shares are traded on stock exchanges, e.g. Nasdaq, Nyse, Euronext, and the easiest way to buy them is through an online stock broker. To do this, you need to open an account and follow a broker's procedures, then start trading. You can trade Abercrombie & Fitch Co. Class A stock right from TradingView charts — choose your broker and connect to your account.
Investing in stocks requires a comprehensive research: you should carefully study all the available data, e.g. company's financials, related news, and its technical analysis. So Abercrombie & Fitch Co. Class A technincal analysis shows the neutral today, and its 1 week rating is sell. Since market conditions are prone to changes, it's worth looking a bit further into the future — according to the 1 month rating Abercrombie & Fitch Co. Class A stock shows the sell signal. See more of Abercrombie & Fitch Co. Class A technicals for a more comprehensive analysis.
If you're still not sure, try looking for inspiration in our curated watchlists.
If you're still not sure, try looking for inspiration in our curated watchlists.