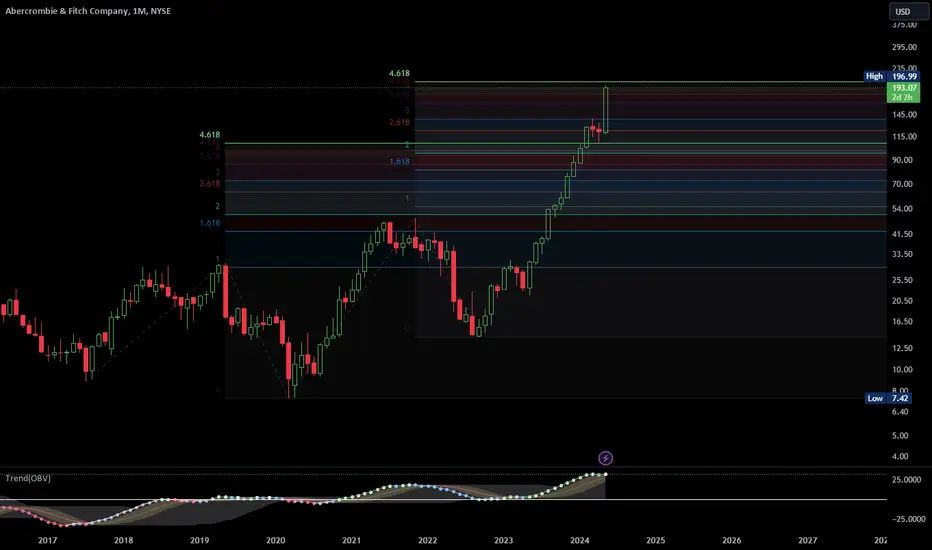
ANF correction before next earningsANF has had an incredible run during these past 12 M and YTD, shooting up over 359% and 94% respectively. The stock is performing tremendously and has even had comparison to AI giant NVDA.
But the NVDA bubble has popped, and I believe ANF will likely follow. With such a huge difference between a 3
Key facts today
Next report date
—
Report period
—
EPS estimate
—
Revenue estimate
—
8.41USD
328.12 MUSD
4.28 BUSD
50.12 M
About Abercrombie & Fitch Company
Sector
Industry
CEO
Fran Horowitz-Bonadies
Website
Headquarters
New Albany
Employees (FY)
31.7 K
Founded
1892
FIGI
BBG000H9G7X2
Abercrombie & Fitch Co. engages in the retail of apparel, personal care products, and accessories. The firm operates through following geographical segments: Americas, EMEA and APAC. The Americas segment includes operations in North America and South America. The EMEA segment includes operations in Europe, the Middle East and Africa. The APAC segment includes operations in the Asia-Pacific region, including Asia and Oceania. The company was founded by David Abercrombie in 1892 and is headquartered in New Albany, OH.

"Confluence of Rivers"while ANF has performed well recently, analysts are cautious about its future growth, suggesting a hold position for current investors and recommending careful consideration before making new investments.

$ANFNYSE:ANF This is setting up nice if it holds here, a few inside days. Expect a breakout coming off great earnings. Looks like its setup up for another cup n handle or just big breakout.

ANF retrace from ATH: eyes on $104 then 92 ideal retrace TargetANF has been on a relentless bull run.
It has obviously hit "a" top if not "the" top.
Mapped are key areas of interest for entries.
$ 111.65-112.64 is current support, should break.
$ 103.14-103.14 is the minimum expected retrace.
$ 91.53 - 92.54 is the 'Ideal" zone for long entries.
Key is to obs

Buy Abercrombie & FitchShort Term Trading Advice by Naranj Capital
Buy Abercrombie & Fitch
● Buy Range- 180 - 185
● Target- 200 - 205
● StopLoss- 170
● Potential Return- 8-11%
● Duration- 12-14 Trading Days

Abercrombie & Fitch Surge On Booming Sales and Higher GuidanceAbercrombie & Fitch ( NYSE:ANF ) shares rose 23.27% to an all-time high on Wednesday as the clothing retailer's first-quarter results exceeded estimates and raised its guidance. The company reported quarterly net income of $113.9 million, nearly seven times greater than a year ago, with earnings per

will $205.5 be $ANF long-term top?Abercrombie & Fitch’s growth was broad-based across regions and brands. Abercrombie brands registered 31% growth, while Hollister brands delivered 12% growth. The company’s agile approach to assortments, marketing, and inventory management contributed to these impressive results
5/28/24 - $anf - see better setups elsewhere, risky. sidelines.5/28/24 - vrockstar - NYSE:ANF - heresy to dislike this valuation? i get it's had a renaissance. it's profitable. 5% yield that's good! 19x PE! good capital stack. it's still cheaper than NASDAQ:LULU without any of the baggage all else equal. the issue here, my friends, is this price point is be

Breakout TradeThe breakout move to the upside signals that the strong uptrend move resumes its due course after a deservedly brief retreat.

ANF recently bounced off 100 MA. Will the rise continue?
ANF's Recent Pullback and Future Outlook
ANF has experienced a significant pullback from its all-time highs after its most recent earnings report. This trend isn't unique to ANF, as even Lululemon (LULU), a market leader, has seen a drawdown since the year's beginning.
However, I believe AN

See all ideas
An aggregate view of professional's ratings.
Trade directly on the supercharts through our supported, fully-verified and user-reviewed brokers.


Curated watchlists where ANF is featured.

Frequently Asked Questions
The current price of ANF is 152.59 USD — it has increased by 0.70% in the past 24 hours. Watch Abercrombie & Fitch Company stock price performance more closely on the chart.
Depending on the exchange, the stock ticker may vary. For instance, on NYSE exchange Abercrombie & Fitch Company stocks are traded under the ticker ANF.
ANF stock has fallen by 2.85% compared to the previous week, the month change is a 11.92% fall, over the last year Abercrombie & Fitch Company has showed a 291.56% increase.
We've gathered analysts' opinions on Abercrombie & Fitch Company future price: according to them, ANF price has a max estimate of 215.00 USD and a min estimate of 172.00 USD. Watch ANF chart and read a more detailed Abercrombie & Fitch Company stock forecast: see what analysts think of Abercrombie & Fitch Company and suggest that you do with its stocks.
ANF stock is 3.20% volatile and has beta coefficient of 1.56. Track Abercrombie & Fitch Company stock price on the chart and check out the list of the most volatile stocks — is Abercrombie & Fitch Company there?
Today Abercrombie & Fitch Company has the market capitalization of 7.74 B, it has increased by 3.61% over the last week.
Yes, you can track Abercrombie & Fitch Company financials in yearly and quarterly reports right on TradingView.
Abercrombie & Fitch Company is going to release the next earnings report on Aug 22, 2024. Keep track of upcoming events with our Earnings Calendar.
ANF earnings for the last quarter are 2.14 USD per share, whereas the estimation was 1.76 USD resulting in a 21.29% surprise. The estimated earnings for the next quarter are 2.17 USD per share. See more details about Abercrombie & Fitch Company earnings.
Abercrombie & Fitch Company revenue for the last quarter amounts to 1.02 B USD, despite the estimated figure of 967.37 M USD. In the next quarter, revenue is expected to reach 1.09 B USD.
ANF net income for the last quarter is 113.85 M USD, while the quarter before that showed 158.45 M USD of net income which accounts for −28.15% change. Track more Abercrombie & Fitch Company financial stats to get the full picture.
Abercrombie & Fitch Company dividend yield was 0% in 2023, and payout ratio reached 0%. The year before the numbers were 0% and 0% correspondingly. See high-dividend stocks and find more opportunities for your portfolio.
As of Jul 27, 2024, the company has 31.70 K employees. See our rating of the largest employees — is Abercrombie & Fitch Company on this list?
EBITDA measures a company's operating performance, its growth signifies an improvement in the efficiency of a company. Abercrombie & Fitch Company EBITDA is 718.80 M USD, and current EBITDA margin is 14.52%. See more stats in Abercrombie & Fitch Company financial statements.
Like other stocks, ANF shares are traded on stock exchanges, e.g. Nasdaq, Nyse, Euronext, and the easiest way to buy them is through an online stock broker. To do this, you need to open an account and follow a broker's procedures, then start trading. You can trade Abercrombie & Fitch Company stock right from TradingView charts — choose your broker and connect to your account.
Investing in stocks requires a comprehensive research: you should carefully study all the available data, e.g. company's financials, related news, and its technical analysis. So Abercrombie & Fitch Company technincal analysis shows the neutral today, and its 1 week rating is buy. Since market conditions are prone to changes, it's worth looking a bit further into the future — according to the 1 month rating Abercrombie & Fitch Company stock shows the buy signal. See more of Abercrombie & Fitch Company technicals for a more comprehensive analysis.
If you're still not sure, try looking for inspiration in our curated watchlists.
If you're still not sure, try looking for inspiration in our curated watchlists.