Astera Labs (NASDAQ: ALAB) is showing a clean higher-timeframe structure, consistently forming higher highs and higher lows, confirming a bullish long-term trend. However, the recent monthly candle shows potential for a short-term retracement, aligning with ICT principles for a re-entry opportunity.
Market Structure:
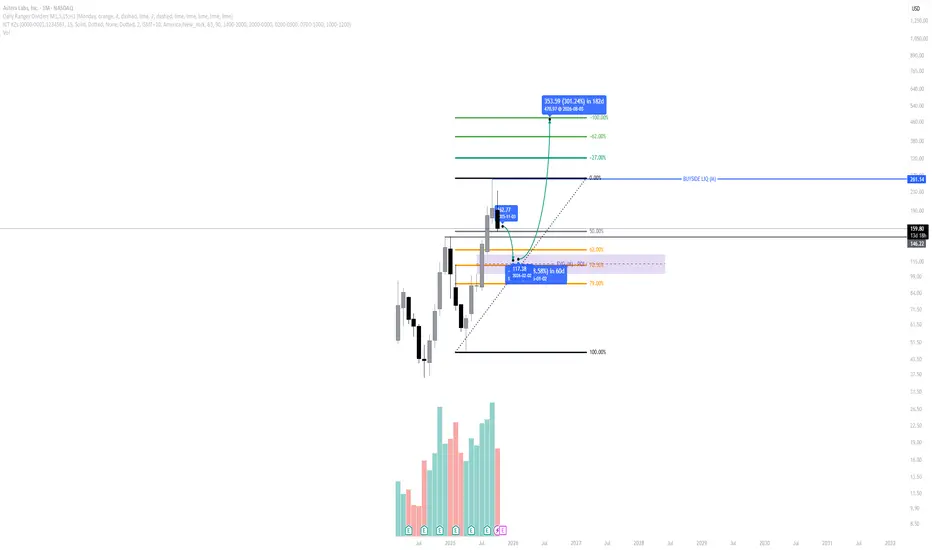
Price continues to respect its bullish framework, printing clear higher highs each impulse and leaving behind well-defined fair value gaps (FVGs) on the monthly chart.
The most recent swing suggests a possible retracement phase as the market seeks balance before another expansion leg.
Premium / Discount Context (OTE Zone):
Using the Fibonacci retracement from the last impulse, the Optimal Trade Entry (OTE) range sits between $122–$99, overlapping with the monthly FVG. This zone aligns perfectly with the 62–79% retracement region — the ideal “smart money” buy zone.
Liquidity Draw:
The buyside liquidity sits around $261, serving as the next major target. If the discount zone holds, the price could deliver a measured move toward $153 first, then a potential continuation toward $352 (long-term projection).
Volume Profile:
Increasing volume throughout prior impulses supports accumulation — indicating strong institutional participation on each retracement leg.
🎯 Outlook
Expect further downside into the FVG/OTE range ($122–$99) before a potential bullish reversal toward the $153–$261 liquidity levels.
If momentum confirms in this range, it could represent one of the best high-probability re-entry zones for 2025.
AS ALWAYS DYOR!
Market Structure:
Price continues to respect its bullish framework, printing clear higher highs each impulse and leaving behind well-defined fair value gaps (FVGs) on the monthly chart.
The most recent swing suggests a possible retracement phase as the market seeks balance before another expansion leg.
Premium / Discount Context (OTE Zone):
Using the Fibonacci retracement from the last impulse, the Optimal Trade Entry (OTE) range sits between $122–$99, overlapping with the monthly FVG. This zone aligns perfectly with the 62–79% retracement region — the ideal “smart money” buy zone.
Liquidity Draw:
The buyside liquidity sits around $261, serving as the next major target. If the discount zone holds, the price could deliver a measured move toward $153 first, then a potential continuation toward $352 (long-term projection).
Volume Profile:
Increasing volume throughout prior impulses supports accumulation — indicating strong institutional participation on each retracement leg.
🎯 Outlook
Expect further downside into the FVG/OTE range ($122–$99) before a potential bullish reversal toward the $153–$261 liquidity levels.
If momentum confirms in this range, it could represent one of the best high-probability re-entry zones for 2025.
AS ALWAYS DYOR!
Disclaimer
The information and publications are not meant to be, and do not constitute, financial, investment, trading, or other types of advice or recommendations supplied or endorsed by TradingView. Read more in the Terms of Use.
Disclaimer
The information and publications are not meant to be, and do not constitute, financial, investment, trading, or other types of advice or recommendations supplied or endorsed by TradingView. Read more in the Terms of Use.