Chip giant Advanced Micro Devices  AMD , which reports earnings this week, has been on a tear of late – rising more than 100% year to date and making large deal after large deal with the likes of artificial-intelligence giant OpenAI. Let's see what AMD's chart and fundamental analysis show us.
Advanced Micro Devices' Fundamental Analysis
AMD plans to report Q3 earnings after the closing bell on Tuesday, with the Street currently looking for $1.17 adjusted earnings per share on about $8.8 billion of revenue.
That would represent a 27.1% gain year over year from the $0.92 in adjusted EPS that AMD reported in Q3 2024, along with about 28.3% annual growth in revenue from $6.8 billion in the same period last year.
In fact, 23 of the 37 sell-side analysts that I know of that cover AMD have revised their earnings estimates higher since the quarter began vs. just 12 who've lowered their forecasts. (Two have left their numbers unchanged.)
Advanced Micro Devices' Technical Analysis
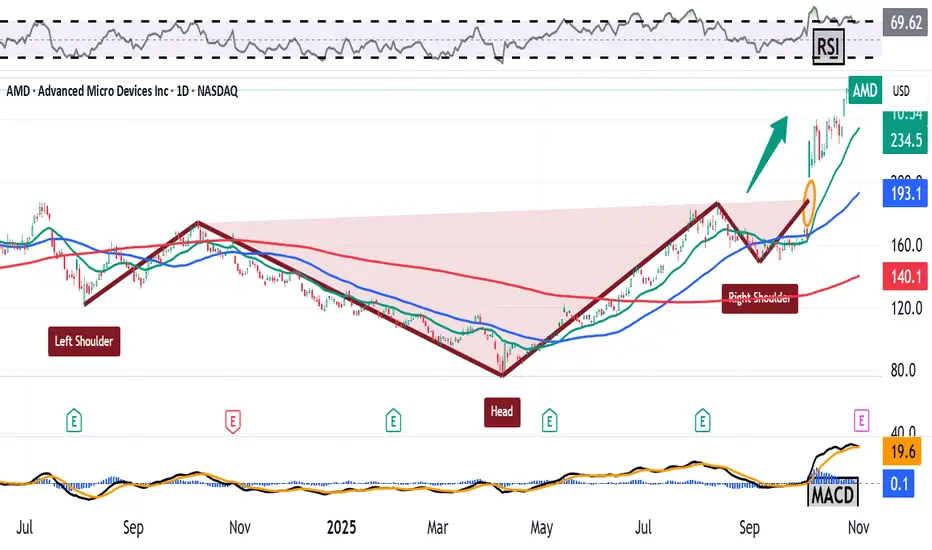
Here's AMD's chart going back some 16 months and running through Tuesday afternoon:

Readers will first note a large "inverted-head-and-shoulders" pattern of bullish reversal that stretches back more than a year.
Marked with a red jagged line and three red boxes, this pattern bears a $189 pivot vs. the low $160s AMD traded at as recently as early October.
Since then, the stock has broken out and run up some 55%, hitting a $267.08 all-time intraday high just last Wednesday. However, that run-up has left an unfilled gap in its wake that would require a print at $164.67 or lower to fill.
What do we know about unfilled gaps? Simple -- they don't have to fill it, but they often do.
So, what might an investor do here?
Well, AMD is currently trading at what some might see as almost obscene premiums to all of its key moving averages. The stock is well above its 21-day Exponential Moving Average (marked with a green line above), 50-day Simple Moving Average (the blue line) and 200-day Simple Moving Average (the red line).
That said, AMD's Relative Strength Index (the gray line at the chart's top) is just north of what many would see as technically overbought territory. Still, the RSI also shows that AMD has been overbought for the better part of a month.
Nonetheless, the stock's daily Moving Average Convergence Divergence indicator (or "MACD," denoted by the black and gold lines and blue bars at the chart's bottom), is still sending bullish signals.
The histogram of AMD's 9-day Exponential Moving Average (or "EMA," marked with blue bars) appears to have cooled recently, but remains in positive territory.
Similarly, the stock's 12-day EMA (the black line) and 26-day EMA (the gold line) remain well into positive territory, with the 12-day line above the 26-day one. Now, the gold line appears to be gaining on the black line (a potentially bearish technical sign), but this is still a short- to medium-term bullish-looking set-up overall.
In fact, this is still a bullish-looking chart in general, although the stock's run above the only visible technical pattern appears stretched.
An Options Option
Options traders who are long AMD might employ what's called a "bear-put spread" in this scenario to help protect their profits without giving up on potential future gains.
This involves buying one put while selling another with a lower strike price and the same expiration date. Here's an example:
-- Purchase one AMD $255 put with a Nov. 7 expiration date (i.e. after the earnings have come out). This currently costs about $3.65.
-- Sell (write) one AMD Nov. 7 $230 put for roughly $0.65.
Net Debit: $3
They would spend $3 to create a "safety valve" at $255 at expiration should AMD sell off after earnings.
However, the trader has also sold a $230 put to reduce the net debit. If the stock falls that far, he or she will also extract a net $22 in capital from the equity trade.
They might also decide to add a covered-call sale to the mix, which would pay for nearly the entire spread if the person is willing to take profits at the call's strike price should AMD run higher after earnings. Example:
-- Sell one Nov. 7 AMD call with a $270 strike price for about $2.80.
Net Debit: $0.20
(Moomoo Technologies Inc. Markets Commentator Stephen "Sarge" Guilfoyle was long AMD at the time of writing this column.)
This article discusses technical analysis, other approaches, including fundamental analysis, may offer very different views. The examples provided are for illustrative purposes only and are not intended to be reflective of the results you can expect to achieve. Specific security charts used are for illustrative purposes only and are not a recommendation, offer to sell, or a solicitation of an offer to buy any security. Past investment performance does not indicate or guarantee future success. Returns will vary, and all investments carry risks, including loss of principal. This content is also not a research report and is not intended to serve as the basis for any investment decision. The information contained in this article does not purport to be a complete description of the securities, markets, or developments referred to in this material. Moomoo and its affiliates make no representation or warranty as to the article's adequacy, completeness, accuracy or timeliness for any particular purpose of the above content. Furthermore, there is no guarantee that any statements, estimates, price targets, opinions or forecasts provided herein will prove to be correct.
Options trading is risky and not appropriate for everyone. Read the Options Disclosure Document (https://j.moomoo.com/017y9J) before trading. Options are complex and you may quickly lose the entire investment. Supporting docs for any claims will be furnished upon request.
Options trading subject to eligibility requirements. Strategies available will depend on options level approved.
Maximum potential loss and profit for options are calculated based on the single leg or an entire multi-leg trade remaining intact until expiration with no option contracts being exercised or assigned. These figures do not account for a portion of a multi-leg strategy being changed or removed or the trader assuming a short or long position in the underlying stock at or before expiration. Therefore, it is possible to lose more than the theoretical max loss of a strategy.
Moomoo is a financial information and trading app offered by Moomoo Technologies Inc. In the U.S., investment products and services on Moomoo are offered by Moomoo Financial Inc., Member FINRA/SIPC.
TradingView is an independent third party not affiliated with Moomoo Financial Inc., Moomoo Technologies Inc., or its affiliates. Moomoo Financial Inc. and its affiliates do not endorse, represent or warrant the completeness and accuracy of the data and information available on the TradingView platform and are not responsible for any services provided by the third-party platform.
Advanced Micro Devices' Fundamental Analysis
AMD plans to report Q3 earnings after the closing bell on Tuesday, with the Street currently looking for $1.17 adjusted earnings per share on about $8.8 billion of revenue.
That would represent a 27.1% gain year over year from the $0.92 in adjusted EPS that AMD reported in Q3 2024, along with about 28.3% annual growth in revenue from $6.8 billion in the same period last year.
In fact, 23 of the 37 sell-side analysts that I know of that cover AMD have revised their earnings estimates higher since the quarter began vs. just 12 who've lowered their forecasts. (Two have left their numbers unchanged.)
Advanced Micro Devices' Technical Analysis
Here's AMD's chart going back some 16 months and running through Tuesday afternoon:
Readers will first note a large "inverted-head-and-shoulders" pattern of bullish reversal that stretches back more than a year.
Marked with a red jagged line and three red boxes, this pattern bears a $189 pivot vs. the low $160s AMD traded at as recently as early October.
Since then, the stock has broken out and run up some 55%, hitting a $267.08 all-time intraday high just last Wednesday. However, that run-up has left an unfilled gap in its wake that would require a print at $164.67 or lower to fill.
What do we know about unfilled gaps? Simple -- they don't have to fill it, but they often do.
So, what might an investor do here?
Well, AMD is currently trading at what some might see as almost obscene premiums to all of its key moving averages. The stock is well above its 21-day Exponential Moving Average (marked with a green line above), 50-day Simple Moving Average (the blue line) and 200-day Simple Moving Average (the red line).
That said, AMD's Relative Strength Index (the gray line at the chart's top) is just north of what many would see as technically overbought territory. Still, the RSI also shows that AMD has been overbought for the better part of a month.
Nonetheless, the stock's daily Moving Average Convergence Divergence indicator (or "MACD," denoted by the black and gold lines and blue bars at the chart's bottom), is still sending bullish signals.
The histogram of AMD's 9-day Exponential Moving Average (or "EMA," marked with blue bars) appears to have cooled recently, but remains in positive territory.
Similarly, the stock's 12-day EMA (the black line) and 26-day EMA (the gold line) remain well into positive territory, with the 12-day line above the 26-day one. Now, the gold line appears to be gaining on the black line (a potentially bearish technical sign), but this is still a short- to medium-term bullish-looking set-up overall.
In fact, this is still a bullish-looking chart in general, although the stock's run above the only visible technical pattern appears stretched.
An Options Option
Options traders who are long AMD might employ what's called a "bear-put spread" in this scenario to help protect their profits without giving up on potential future gains.
This involves buying one put while selling another with a lower strike price and the same expiration date. Here's an example:
-- Purchase one AMD $255 put with a Nov. 7 expiration date (i.e. after the earnings have come out). This currently costs about $3.65.
-- Sell (write) one AMD Nov. 7 $230 put for roughly $0.65.
Net Debit: $3
They would spend $3 to create a "safety valve" at $255 at expiration should AMD sell off after earnings.
However, the trader has also sold a $230 put to reduce the net debit. If the stock falls that far, he or she will also extract a net $22 in capital from the equity trade.
They might also decide to add a covered-call sale to the mix, which would pay for nearly the entire spread if the person is willing to take profits at the call's strike price should AMD run higher after earnings. Example:
-- Sell one Nov. 7 AMD call with a $270 strike price for about $2.80.
Net Debit: $0.20
(Moomoo Technologies Inc. Markets Commentator Stephen "Sarge" Guilfoyle was long AMD at the time of writing this column.)
This article discusses technical analysis, other approaches, including fundamental analysis, may offer very different views. The examples provided are for illustrative purposes only and are not intended to be reflective of the results you can expect to achieve. Specific security charts used are for illustrative purposes only and are not a recommendation, offer to sell, or a solicitation of an offer to buy any security. Past investment performance does not indicate or guarantee future success. Returns will vary, and all investments carry risks, including loss of principal. This content is also not a research report and is not intended to serve as the basis for any investment decision. The information contained in this article does not purport to be a complete description of the securities, markets, or developments referred to in this material. Moomoo and its affiliates make no representation or warranty as to the article's adequacy, completeness, accuracy or timeliness for any particular purpose of the above content. Furthermore, there is no guarantee that any statements, estimates, price targets, opinions or forecasts provided herein will prove to be correct.
Options trading is risky and not appropriate for everyone. Read the Options Disclosure Document (https://j.moomoo.com/017y9J) before trading. Options are complex and you may quickly lose the entire investment. Supporting docs for any claims will be furnished upon request.
Options trading subject to eligibility requirements. Strategies available will depend on options level approved.
Maximum potential loss and profit for options are calculated based on the single leg or an entire multi-leg trade remaining intact until expiration with no option contracts being exercised or assigned. These figures do not account for a portion of a multi-leg strategy being changed or removed or the trader assuming a short or long position in the underlying stock at or before expiration. Therefore, it is possible to lose more than the theoretical max loss of a strategy.
Moomoo is a financial information and trading app offered by Moomoo Technologies Inc. In the U.S., investment products and services on Moomoo are offered by Moomoo Financial Inc., Member FINRA/SIPC.
TradingView is an independent third party not affiliated with Moomoo Financial Inc., Moomoo Technologies Inc., or its affiliates. Moomoo Financial Inc. and its affiliates do not endorse, represent or warrant the completeness and accuracy of the data and information available on the TradingView platform and are not responsible for any services provided by the third-party platform.
Disclaimer
The information and publications are not meant to be, and do not constitute, financial, investment, trading, or other types of advice or recommendations supplied or endorsed by TradingView. Read more in the Terms of Use.
Disclaimer
The information and publications are not meant to be, and do not constitute, financial, investment, trading, or other types of advice or recommendations supplied or endorsed by TradingView. Read more in the Terms of Use.