The Good (Bullish Side)
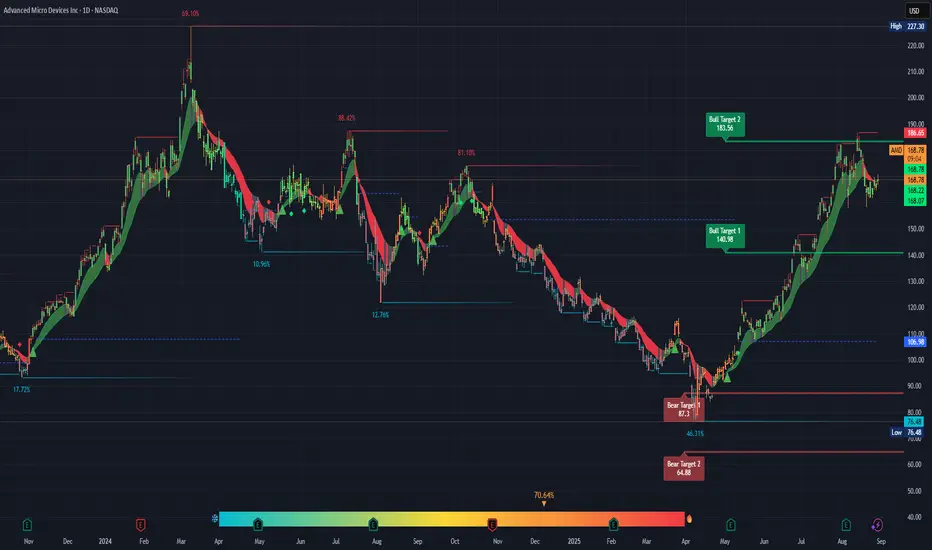
Uptrend Recovery: After bottoming near $76 in April 2025, AMD has made a strong rebound, more than doubling into the $180s. That’s a powerful recovery with momentum behind it.
Support Levels: $140.98 (Bull Target 1, now support) held beautifully during the climb. As long as price stays above that zone, bulls remain in control.
EMA Structure: The green ribbon is showing bullish alignment, with short-term EMAs stacked above longer-term ones. Trend is intact despite the pullback.
Targets: Bull target 2 is $183.56. If AMD breaks above $186.65 (recent resistance), it has room to run higher.
The Bad (Bearish Side)
Resistance at $186.65: Price already got rejected at that level. Until AMD closes convincingly above it, this ceiling is heavy.
Lower High Risk: If AMD fails to reclaim $186 and rolls over, it risks forming a lower high — which could signal a deeper retrace.
Macro Weakness: Semi stocks (including AMD) are cyclical. If broader tech/economy cools, AMD can easily retrace to the $140–150 zone.
“Too Good to Be True” Filter
The recent rally from ~$76 to ~$186 is a 142% move in ~4 months. Moves that vertical rarely sustain without corrections. Expect at least some chop or a larger retracement before continuation.
Cost vs. Benefit Analysis
Chasing now (~$168–170): High risk since you’re buying under resistance. Best case you capture a breakout, worst case you eat a $20–30 pullback.
Waiting for confirmation ($186+ breakout): Lower risk entry, but you’ll miss the first 10% of the move.
Buying a retrace to $150–155: Better reward/risk, but you risk missing the run if it never pulls back that far.
✅ Bottom Line: Looking good overall, but this is not a safe buy point. AMD is stuck between resistance and support. Smart money waits for either a breakout above $186 with volume or a dip closer to $150 for better risk/reward.
Disclaimer
The information and publications are not meant to be, and do not constitute, financial, investment, trading, or other types of advice or recommendations supplied or endorsed by TradingView. Read more in the Terms of Use.
Disclaimer
The information and publications are not meant to be, and do not constitute, financial, investment, trading, or other types of advice or recommendations supplied or endorsed by TradingView. Read more in the Terms of Use.