📍 To see my confluences and/or linework: Step 1: Grab chart 📊 Step 2: Unhide Group 1 in object tree 🌳 Step 3: Hide and unhide specific confluences one by one 🔍 Step 4: Double-click the screen to reveal RSI, MFI, CVD, and OBV indicators with divergence markings! 📈
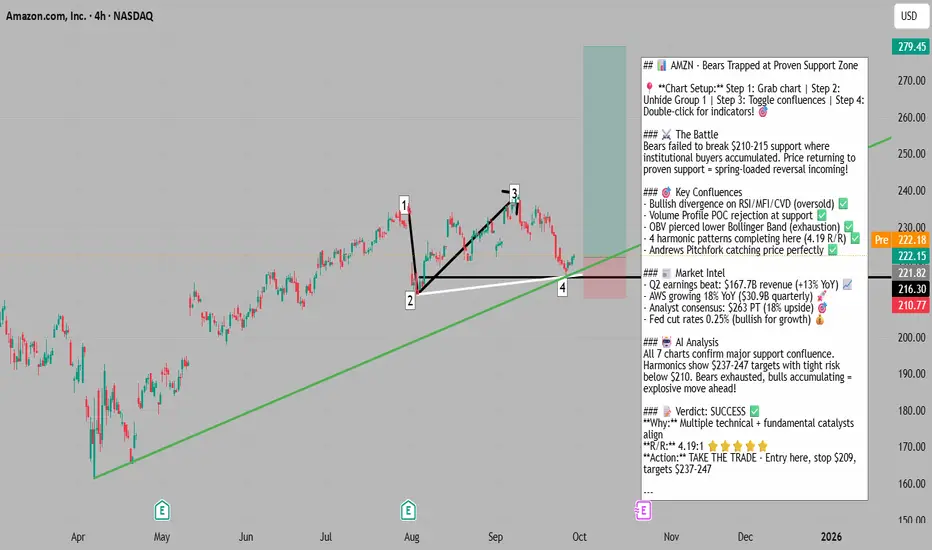
🎯 AMZN: Bears Exhausted at Support - Spring-Loaded Reversal
The Market Participant Battle:
At point 2, bears attempted a major breakdown below the rising channel support, trying to trigger a cascade of stop losses and establish a new downtrend. However, bulls defended aggressively, creating a proven support zone. The move from point 2 to point 3 confirmed bulls' dominance, establishing this level as "proven buyers territory." Now at point 4, we're returning to this same proven support where institutional buyers previously showed their hand. Bears have exhausted their ammunition with multiple failed attempts to break lower, setting up a powerful reversal as price returns to where the smart money accumulated.
Confluences:
Confluence 1: Bullish Divergence Convergence 🔥
At point 4, we have a spectacular bullish divergence setup across multiple indicators. While price made a higher low, RSI, MFI, and CVD candles all printed lower lows - a classic sign of bearish exhaustion. This divergence indicates selling pressure is weakening despite price holding higher, suggesting accumulation is occurring beneath the surface. Both RSI and MFI are in oversold territory, providing the fuel for an explosive move higher.
Confluence 2: Volume Profile POC Rejection 📊
The volume profile from points 1 to 2 shows the Point of Control (highest volume node) sitting exactly at point 2. Price has now returned to test the Value Area High and was immediately rejected upward. This demonstrates that the majority of trading volume occurred at these levels, creating a massive support zone where institutional buyers are defending their positions.
Confluence 3: OBV Bollinger Band Pierce 💪
At point 4, On-Balance Volume pierced below its lower Bollinger Band - a rare occurrence that historically precedes sharp reversals. This suggests that despite the price decline, actual selling volume is reaching exhaustion levels. The OBV divergence confirms accumulation is happening while weak hands are being shaken out.
Confluence 4: VWAP Deviation Trap 🎯
At point 2, price dipped below the first VWAP standard deviation, failed to reach the second deviation (showing limited selling momentum), then aggressively closed back above the first deviation. This trapped bears who were betting on continued downside and created a liquidity vacuum above as shorts scrambled to cover.
Confluence 5: Andrews Pitchfork Precision 📐
The Andrews Pitchfork catches point 4 with surgical precision at its lower median line. This technical tool, favored by institutional traders, provides a mathematical framework showing we're at the extreme lower boundary of the current trend channel. The bounce from this level confirms its significance.
Confluence 6: Harmonic Pattern Convergence 🦋
We have four harmonic patterns all completing at the current level: a Butterfly, Cypher, Bat, and Anti-Cypher. This rare convergence creates a powerful confluence zone. The Butterfly pattern shows a 20.88% profit potential with a 4.19 risk/reward ratio. Multiple harmonic completions at one price level indicate a high-probability reversal zone.
Web Research Findings:
- Technical Analysis: Current RSI at 39.13 indicates neutral conditions with MACD at -0.50 suggesting a buy signal. Multiple moving averages are converging near current levels creating a support cluster.
- Recent News/Earnings: Q2 2025 earnings exceeded expectations with $167.7B revenue (vs $162.09B expected) and $1.68 EPS (vs $1.33 expected). AWS revenue grew 18% YoY to $30.87B.
- Analyst Sentiment: 45 analysts maintain "Strong Buy" consensus with average price target of $262.98, representing 18.37% upside. Recent upgrades from major firms with targets ranging from $230 to $305.
- Data Releases & Economic Calendar: Next earnings expected October 27-31, 2025. Company has beaten EPS estimates 100% of the time in past 12 months.
- Interest Rate Impact: Fed cut rates by 0.25% in September to 4.00%-4.25% range, with two more cuts expected in 2025. Lower rates support growth stock valuations and reduce AWS customers' financing costs.
Layman's Summary:
Think of this trade like a compressed spring. Bears pushed the stock down hard multiple times but couldn't break the floor at $210-215. Each failed attempt made them weaker while bulls quietly accumulated shares. The technical indicators are screaming "oversold" while big institutions are raising their price targets. With the Fed cutting rates (making money cheaper to borrow) and Amazon's cloud business growing strongly, the stock is coiled for a bounce. It's like watching a basketball being pushed underwater - the harder you push, the more violent the bounce when you let go.
Machine Derived Information:
- Image 1 (4H Chart): Rising channel with numbered pivot points - Significance: Shows clear support at point 2 with successful retest at point 4 - AGREES ✔
- Image 2 (4H Duplicate): Confirms first image setup - Significance: Reinforces support zone validity - AGREES ✔
- Image 3 (4H Pitch Fork): Multiple overlapping trendlines converging at current price - Significance: Creates strong magnetic price level - AGREES ✔
- Image 4 (4H Zone): Green and red zones marking supply/demand areas - Significance: Currently at demand zone bottom - AGREES ✔
- Image 5 (4H Channel): Ascending channel with clear boundaries - Significance: Price at lower channel support - AGREES ✔
- Image 6 (4H Horizontal): Key horizontal support at point 2 - Significance: Major support successfully defended - AGREES ✔
- Image 7 (4H Harmonics): Four harmonic patterns completing - Significance: High-probability reversal zone with 4.19 R/R - AGREES ✔
Actionable Machine Summary:
All seven chart images unanimously confirm we're at a critical support level with multiple technical factors aligning for a reversal. The combination of horizontal support, channel support, harmonic pattern completions, and oversold indicators with bullish divergences creates an extremely high-probability long setup. Risk is clearly defined below $210 with targets at $237-$247 based on harmonic projections and analyst consensus.
Conclusion:
Trade Prediction: SUCCESS ✅
Confidence: High
This setup presents a textbook accumulation pattern where smart money has established a floor and retail bears are exhausted. The confluence of bullish divergences, volume profile support, harmonic completions, and fundamental tailwinds from AWS growth and Fed rate cuts creates an asymmetric risk/reward opportunity. Entry at current levels with stops below $210 offers 4:1 reward potential to initial targets.
all my paid ( pro ) scripts can be obtained for a low price of 19.99 / month at : whop.com/sabr-pro-tools/access-to-all-pro-tools/
Disclaimer
The information and publications are not meant to be, and do not constitute, financial, investment, trading, or other types of advice or recommendations supplied or endorsed by TradingView. Read more in the Terms of Use.