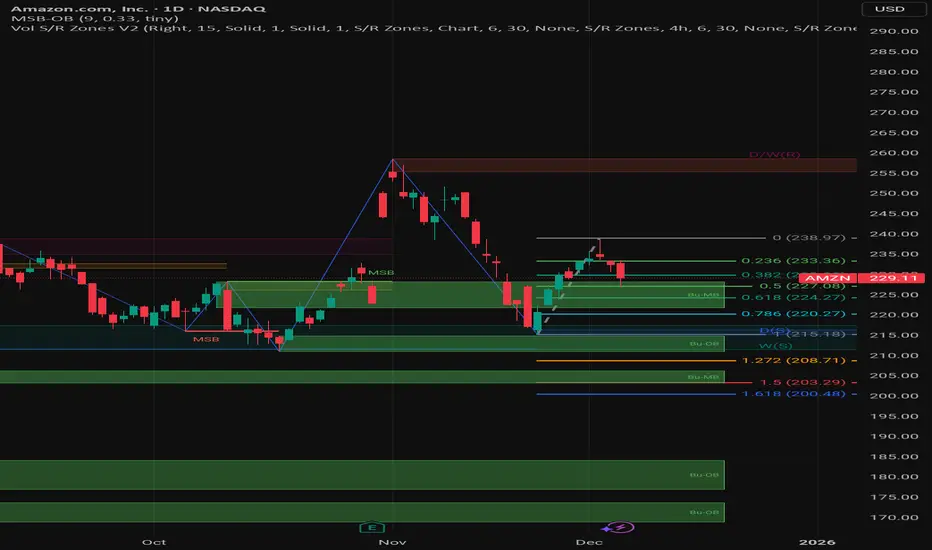
Current Price: 229.11 (Down -1.41% for the day).
Trend: Short-term bearish. The stock recently peaked at Point C (~239.00) and is currently rejecting that level, moving downwards to test immediate support zones.
Key Technical Elements
1. The ABC Structure
Leg A to B:** A significant drop from the high of ~255 down to ~215.
Leg B to C:** A corrective rally (retracement) that pushed price back up to ~239. This failed to make a higher high, creating a "Lower High" at Point C, which is a bearish signal.
Current Leg (C to D): The price is now dropping from C. The chart annotations suggest a target (PRZ) significantly lower, anticipating that this leg will extend downward.
2. Fibonacci Retracement Levels
The chart displays Fibonacci levels drawn from the low (Point B) to the high (Point C) to measure support during this pullback:
0.382 Level (229.90): The price is currently battling this level. A close below here opens the door to lower supports.
0.5 Level (227.08): The mid-point of the previous rally.
0.618 "Golden Pocket" (224.27): This is the most critical immediate support. It aligns perfectly with the green Bullish Order Block (Bu-OB).
3. Order Blocks (Support Zones)
Upper Green Zone (220.00 - 227.00): This is a strong demand zone ("Bu-OB"). This area previously acted as a base for the rally to Point C. If price enters this box, technical traders often look for a bounce.
Lower Green Zones:** There are deeper support blocks around 180.00 and 170.00, but these are far away from current price action.
Projected Scenarios
Bearish Scenario (The Chart's Primary Bias)
The chart labels a "PRZ: AB=CD 3" (Potential Reversal Zone) much lower, around the 195.00 - 200.00 area.
For this to happen, price must break the 0.618 Fib support (224.27) and the previous low at Point B (215.18).
If Point B breaks, the pattern implies a 1:1 extension (where the C-D leg equals the length of the A-B leg), targeting that ~200 zone.
Bullish Scenario
* The bulls need to defend the **0.5 (227.08) or the **0.618 (224.27) Fibonacci levels.
* A bounce from the green box (220-227) would form a "Higher Low" compared to Point B, potentially setting up a trend reversal to the upside.
Disclaimer
The information and publications are not meant to be, and do not constitute, financial, investment, trading, or other types of advice or recommendations supplied or endorsed by TradingView. Read more in the Terms of Use.
Disclaimer
The information and publications are not meant to be, and do not constitute, financial, investment, trading, or other types of advice or recommendations supplied or endorsed by TradingView. Read more in the Terms of Use.