1. Overview
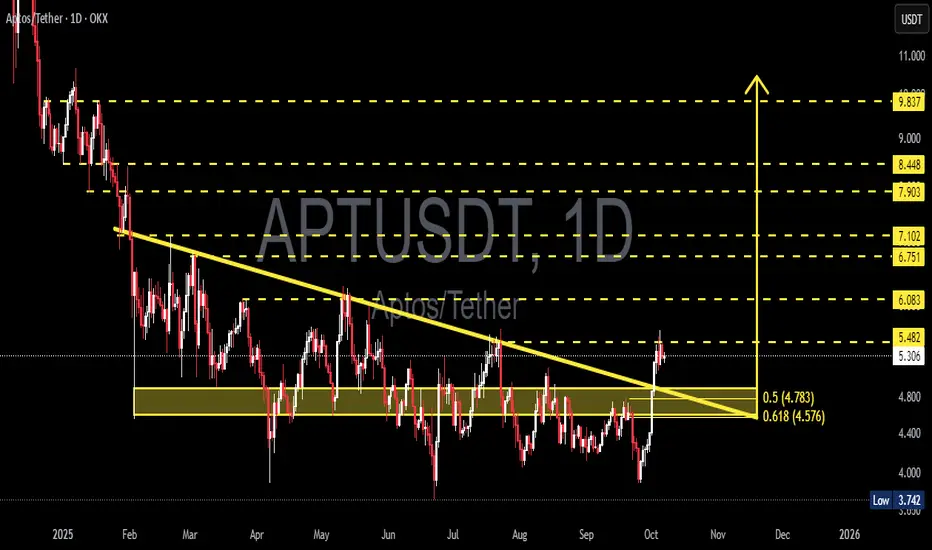
APT/USDT has been in a medium-term downtrend since early 2025, consistently forming lower highs and lower lows along the primary descending trendline (yellow).
Recently, however, the market has shown a clear shift in momentum: price successfully broke above the descending trendline and is now trading above a major confluence area between Fibonacci 0.5 and 0.618 (4.78–4.57).
This zone serves as the primary demand base, where historical accumulation by buyers has previously occurred. The breakout indicates a possible early stage of structural reversal, transitioning from a bearish environment toward a medium-term bullish phase.
---
2. Structure and Pattern
Over the past nine months, APT has formed a Descending Channel / Triangle pattern, where selling pressure gradually weakened as buyers began absorbing liquidity at lower levels.
The breakout above the trendline suggests a trendline breakout followed by a demand retest, a classic setup often signaling the start of a trend reversal.
If the 4.57–4.78 zone holds during the retest, the price structure could evolve into a compressed Inverse Head & Shoulders, further strengthening the bullish reversal narrative.
---
3. Key Technical Levels
The technical structure of APT can be summarized through several critical zones:
Main Demand Zone (4.783 – 4.576)
This is the key confluence area between the 0.5 and 0.618 Fibonacci retracements. Buyers have previously shown strong reactions here. Holding this level is crucial to validate the current breakout.
Immediate Resistance (5.482)
This marks the breakout line of the long-term descending trendline and the first significant psychological resistance. A daily close above this zone would confirm bullish continuation.
Major Support (3.742)
This is the main structural low formed during the previous capitulation phase. A breakdown below this level would invalidate the bullish structure and signal a potential continuation of the downtrend.
Upside Targets (Fibonacci Extensions)
Upon successful confirmation, price targets are projected at 6.083, 6.751, and 7.102, with extended targets at 7.903, 8.448, and 9.837.
The 4.57–4.78 region now acts as the core battlefield between buyers and sellers — defending this zone keeps the bullish structure intact.
---
4. Bullish Scenario
Confirmation Conditions:
Daily close above 5.48 with strong volume, or
Successful retest and bounce from 4.58–4.78.
If these conditions are met, the likelihood of sustained bullish continuation increases significantly.
Projected upside targets:
Target 1: 6.083
Target 2: 6.751
Target 3: 7.102
Momentum extension could push toward 7.90–9.84 if volume and sentiment align.
Additional confirmations:
RSI rising above 50 → showing positive momentum.
MACD golden cross in the positive zone → trend strength confirmation.
Increasing breakout volume → evidence of institutional accumulation.
Bullish invalidation: daily close below 4.576.
---
5. Bearish Scenario
If price fails to sustain above 5.48 and instead breaks down through the 4.58–4.78 zone, the breakout will be classified as a false breakout.
In this case, potential downside includes:
Short-term pullback toward 4.00,
And a deeper retest near 3.742, the major structural support.
A daily close below 3.742 would confirm trend continuation to the downside and nullify the reversal structure.
---
6. Market Sentiment and Dynamics
APT is currently in a transition phase between capitulation and re-accumulation.
The breakout above the trendline, combined with increasing buying volume, suggests a change in market character — shifting from selling pressure to growing demand.
If the broader crypto environment remains stable and risk appetite returns to altcoins, APT could become one of the stronger Layer-1 recovery candidates in the coming cycle.
However, two main risks remain:
1. False breakout caused by weak volume.
2. Low liquidity at higher levels that may lead to sharp retracements before continuation.
---
7. Trading Approach (Not Financial Advice)
A. Conservative Swing Approach
Entry: confirmed bounce at 4.78–4.60
Stop Loss: below 4.40
Take Profit: 6.08 / 6.75 / 7.10
Risk:Reward: approximately 1:3
B. Momentum Approach
Entry: breakout confirmation above 5.48 with strong volume
Stop Loss: below 4.78
Target: 6.75–7.10
---
8. Conclusion
APT/USDT stands at a technically decisive point.
The breakout above the long-term descending trendline signals a potential major shift in market direction.
However, full confirmation depends on the ability of the 4.58–4.78 zone to hold during the retest.
If the zone holds, the next move toward 6.75–7.10 could unfold over the coming weeks.
If it fails, sellers may regain control, pulling the price back to 3.74 and continuing the broader downtrend.
The coming sessions will determine whether this marks the beginning of a true bullish reversal or merely a temporary false breakout.
---
9. Relevant Hashtags
#APT #APTUSDT #Aptos #CryptoAnalysis #TechnicalAnalysis #Breakout #SupplyDemand #Fibonacci #SupportResistance #SwingTrading #PriceAction #TrendReversal #Altcoins #CryptoMarket
✅ Get Free Signals! Join Our Telegram Channel Here: t.me/TheCryptoNuclear
✅ Twitter: twitter.com/crypto_nuclear
✅ Join Bybit : partner.bybit.com/b/nuclearvip
✅ Benefits : Lifetime Trading Fee Discount -50%
✅ Twitter: twitter.com/crypto_nuclear
✅ Join Bybit : partner.bybit.com/b/nuclearvip
✅ Benefits : Lifetime Trading Fee Discount -50%
Disclaimer
The information and publications are not meant to be, and do not constitute, financial, investment, trading, or other types of advice or recommendations supplied or endorsed by TradingView. Read more in the Terms of Use.