Executive Summary:
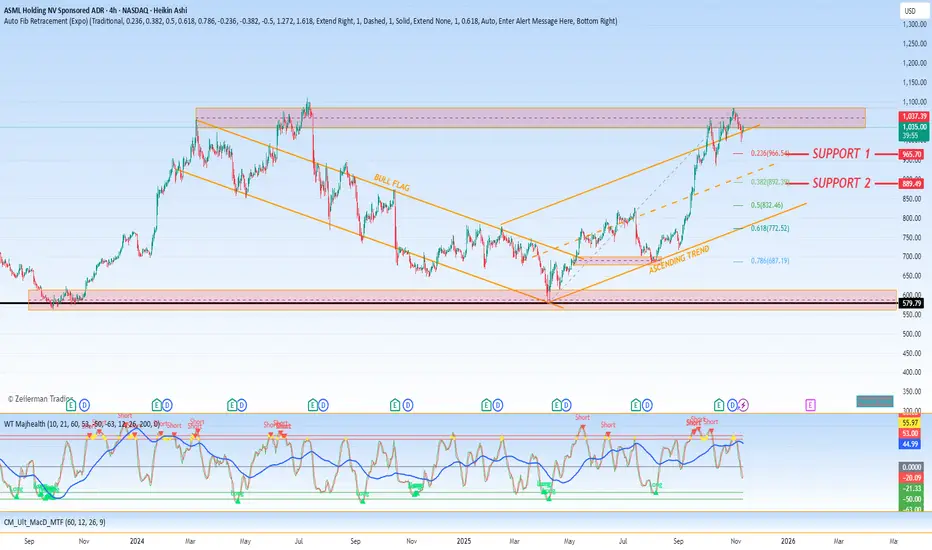
ASML ( ASML) is exhibiting a compelling technical picture defined by a period of consolidation within a larger bullish structure. The chart has formed a clear Double Top pattern followed by a Double Bottom, signaling a battle between buyers and sellers that has now resolved to the upside. This sequence, coupled with the recent formation and subsequent breakout from a Bull Flag pattern, indicates a resurgence of bullish momentum. Our analysis confirms a renewed upward trajectory, with key Fibonacci retracement levels at $966.54 and $892.39 established as critical support zones for any future pullbacks.
Detailed Technical Breakdown:
1. Pattern Evolution: From Consolidation to Breakout
The recent price action can be interpreted as a cohesive, multi-stage pattern signaling a healthy consolidation before a continuation of the primary uptrend:
Phase 1: Distribution & Testing (Double Top): The initial formation of a Double Top pattern near the highs represented a period of distribution and failed breakout attempts. This pattern indicated that selling pressure was sufficient to halt the advance at a specific resistance level, leading to a subsequent decline. In this context, it served as the distribution phase within the larger consolidation.
Phase 2: Accumulation & Base-Building (Double Bottom): The decline from the Double Top's neckline found firm support, forming a Double Bottom pattern. This is a classic reversal indicator, demonstrating that buyers were aggressively defending a specific price level and that the selling pressure from the Double Top had been exhausted. This pattern represented the successful test of a major support level and the accumulation phase.
Phase 3: Bull Flag & Momentum Renewal: Following the Double Bottom's confirmation, the price ascended into a Bull Flag pattern—a tight, downward-sloping consolidation characterized by declining volume. This pattern is typically a pause in a strong uptrend, reflecting a brief period of profit-taking before the next leg higher. The recent breakout above the flag's upper boundary signals the conclusion of this consolidation and the resumption of the dominant bullish trend.
2. Hierarchical Support Framework:
In the context of this renewed uptrend, the following Fibonacci retracement levels (derived from the most significant prior upward move) provide a structured roadmap for potential pullbacks, offering strategic entry points:
Primary Support (Shallow Pullback): 23.6% Level at $966.54
A retracement to this level would represent a minimal and healthy withdrawal within a strong trend. A bounce from this zone would signify potent underlying momentum and would be the most bullish of the potential pullback scenarios, suggesting a swift continuation toward higher highs.
Secondary & Major Support (Moderate Correction): 38.2% Level at $892.39
A deeper pullback to the $892.39 level would constitute a more significant test of buyer conviction. This level, known as the "shallow retracement," is a common area for institutional re-entry. While indicating greater near-term weakness than a test of the 23.6% level, a successful hold here would reaffirm the overall bullish structure and present a high-value opportunity for capital allocation.
3. Strategic Outlook and Price Projection:
The confluence of the Double Bottom reversal and the Bull Flag breakout provides a high-confidence bullish signal. The pattern's resolution suggests that the consolidation period has effectively recharged momentum for the next advance.
Implication: The path of least resistance is now firmly to the upside. The breakout from the Bull Flag projects a measured move target that is typically equivalent to the length of the preceding "flagpole," which points to a significant upward projection (a specific target can be calculated by adding the flagpole's height to the breakout point).
Strategy: The tactical approach is to view any pullback as a potential buying opportunity within the larger bullish trend. The identified Fibonacci levels at $966.54 and $892.39 serve as defined zones for strategic entry. A decisive break below the deeper $892 support, however, would necessitate a re-evaluation of the immediate bullish thesis, suggesting a broader correction may be underway.
ASML (
Detailed Technical Breakdown:
1. Pattern Evolution: From Consolidation to Breakout
The recent price action can be interpreted as a cohesive, multi-stage pattern signaling a healthy consolidation before a continuation of the primary uptrend:
Phase 1: Distribution & Testing (Double Top): The initial formation of a Double Top pattern near the highs represented a period of distribution and failed breakout attempts. This pattern indicated that selling pressure was sufficient to halt the advance at a specific resistance level, leading to a subsequent decline. In this context, it served as the distribution phase within the larger consolidation.
Phase 2: Accumulation & Base-Building (Double Bottom): The decline from the Double Top's neckline found firm support, forming a Double Bottom pattern. This is a classic reversal indicator, demonstrating that buyers were aggressively defending a specific price level and that the selling pressure from the Double Top had been exhausted. This pattern represented the successful test of a major support level and the accumulation phase.
Phase 3: Bull Flag & Momentum Renewal: Following the Double Bottom's confirmation, the price ascended into a Bull Flag pattern—a tight, downward-sloping consolidation characterized by declining volume. This pattern is typically a pause in a strong uptrend, reflecting a brief period of profit-taking before the next leg higher. The recent breakout above the flag's upper boundary signals the conclusion of this consolidation and the resumption of the dominant bullish trend.
2. Hierarchical Support Framework:
In the context of this renewed uptrend, the following Fibonacci retracement levels (derived from the most significant prior upward move) provide a structured roadmap for potential pullbacks, offering strategic entry points:
Primary Support (Shallow Pullback): 23.6% Level at $966.54
A retracement to this level would represent a minimal and healthy withdrawal within a strong trend. A bounce from this zone would signify potent underlying momentum and would be the most bullish of the potential pullback scenarios, suggesting a swift continuation toward higher highs.
Secondary & Major Support (Moderate Correction): 38.2% Level at $892.39
A deeper pullback to the $892.39 level would constitute a more significant test of buyer conviction. This level, known as the "shallow retracement," is a common area for institutional re-entry. While indicating greater near-term weakness than a test of the 23.6% level, a successful hold here would reaffirm the overall bullish structure and present a high-value opportunity for capital allocation.
3. Strategic Outlook and Price Projection:
The confluence of the Double Bottom reversal and the Bull Flag breakout provides a high-confidence bullish signal. The pattern's resolution suggests that the consolidation period has effectively recharged momentum for the next advance.
Implication: The path of least resistance is now firmly to the upside. The breakout from the Bull Flag projects a measured move target that is typically equivalent to the length of the preceding "flagpole," which points to a significant upward projection (a specific target can be calculated by adding the flagpole's height to the breakout point).
Strategy: The tactical approach is to view any pullback as a potential buying opportunity within the larger bullish trend. The identified Fibonacci levels at $966.54 and $892.39 serve as defined zones for strategic entry. A decisive break below the deeper $892 support, however, would necessitate a re-evaluation of the immediate bullish thesis, suggesting a broader correction may be underway.
Trade active
SUPPORT 1 HIT Disclaimer
The information and publications are not meant to be, and do not constitute, financial, investment, trading, or other types of advice or recommendations supplied or endorsed by TradingView. Read more in the Terms of Use.
Disclaimer
The information and publications are not meant to be, and do not constitute, financial, investment, trading, or other types of advice or recommendations supplied or endorsed by TradingView. Read more in the Terms of Use.