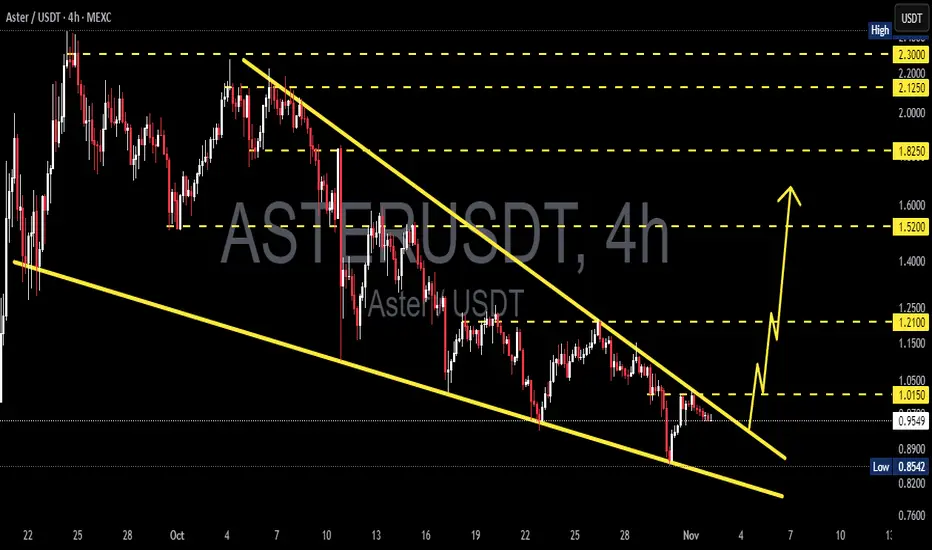
The ASTER/USDT pair currently shows a very interesting technical structure, where price has been moving inside a Falling Wedge pattern since mid-October.
This formation is widely recognized as one of the most powerful bullish reversal patterns, signaling that selling pressure is weakening while buyers begin to take control.
At the moment, price is hovering around $0.95, approaching the apex of the wedge, which indicates that the consolidation phase is nearing a breakout point. The contracting volume reflects that the market is waiting for confirmation of the next major move.
---
Main Pattern Characteristics
Falling Wedge Pattern:
Two converging downward-sloping trendlines clearly define this setup, showing that sellers are losing strength.
Historically, this pattern often ends with a bullish breakout, especially when it forms after a long downtrend.
Volume & Momentum:
Volume has been decreasing throughout the wedge formation, which is normal — but a strong breakout is typically confirmed by a sharp volume surge.
Watch for bullish RSI divergence (price making lower lows while RSI makes higher lows) as an early confirmation of a potential reversal.
---
Bullish Scenario
If ASTER manages to break and close above the wedge resistance area near $1.01 – $1.05 on the 4H timeframe, it would mark a strong bullish reversal signal.
Gradual upside targets:
1. $1.21 – First breakout confirmation target.
2. $1.52 – Key psychological resistance.
3. $1.82 – $2.10 – Momentum expansion zone where buyers could dominate.
4. $2.30 – Extended target if the bullish rally strengthens.
A strong breakout with rising volume could be the starting point of a new bullish trend for ASTER.
---
Bearish Scenario
Conversely, if price fails to break above resistance and drops back below $0.89 – $0.85, a breakdown scenario could unfold, targeting the $0.76 area.
A close below wedge support would confirm that sellers still have control.
However, statistically, falling wedge structures are more likely to resolve bullishly, as long as the price does not close decisively below the lower boundary.
---
Summary
The ASTER/USDT chart is currently at a critical decision point — between continued consolidation or the beginning of a major reversal.
Technically, the combination of a tightening wedge, declining volume, and possible RSI divergence indicates that a major breakout may be approaching.
If confirmed, bullish momentum could accelerate rapidly, supported by growing liquidity near the wedge’s lower range.
#ASTER #ASTRUSDT #FallingWedge #CryptoBreakout #TechnicalAnalysis #ChartPattern #BullishSetup #CryptoMarket #SwingTrade #PriceAction #ReversalPattern #CryptoAnalysis
✅ Get Free Signals! Join Our Telegram Channel Here: t.me/TheCryptoNuclear
✅ Twitter: twitter.com/crypto_nuclear
✅ Join Bybit : partner.bybit.com/b/nuclearvip
✅ Benefits : Lifetime Trading Fee Discount -50%
✅ Twitter: twitter.com/crypto_nuclear
✅ Join Bybit : partner.bybit.com/b/nuclearvip
✅ Benefits : Lifetime Trading Fee Discount -50%
Disclaimer
The information and publications are not meant to be, and do not constitute, financial, investment, trading, or other types of advice or recommendations supplied or endorsed by TradingView. Read more in the Terms of Use.