📊 Overview
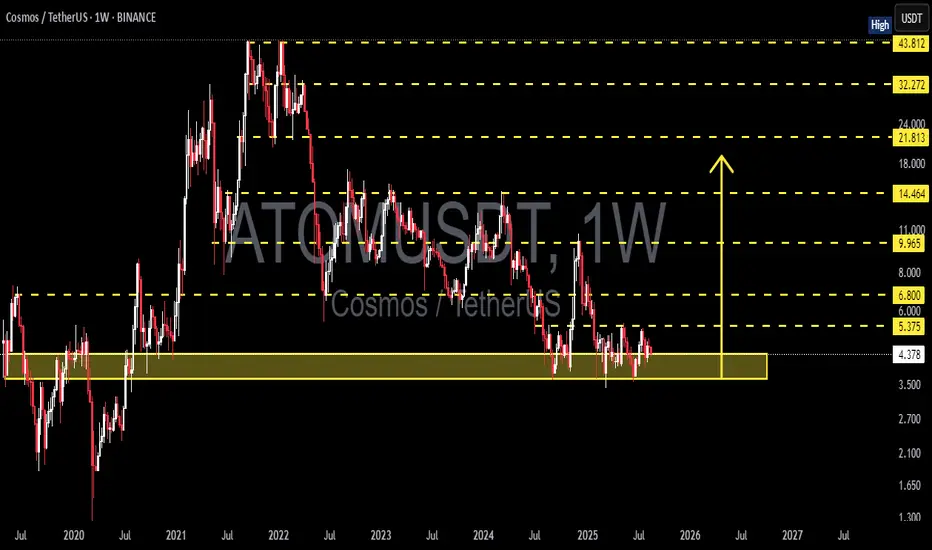
The ATOM/USDT weekly chart shows that the price is currently in a long-term accumulation phase after a massive downtrend since 2022.
The 3.5–4.6 USDT demand zone has acted as a strong historical support level since 2020 and has once again proven its strength during 2024–2025.
In simple terms, this area is the “last defense” zone for buyers and could determine whether ATOM will start a new bullish cycle or face a deeper breakdown.
---
🔹 Structure & Pattern Analysis
Macro Pattern: ATOM has formed a wide sideways/base structure near the multi-year demand, signaling potential accumulation by smart money.
Key resistance (short-term): 5.375 – 6.00 USDT, the first gate to confirm a bullish reversal.
Further resistances: 6.80 → 9.96 → 14.46 (strong mid-cycle supply).
If broken: The path opens toward 21.81 – 32.27 USDT, aligning with higher timeframe resistances.
---
✅ Bullish Scenario
1. Price continues to hold above the 3.5–4.6 demand zone, showing strong buyer presence.
2. A confirmed breakout above 5.375 with volume could shift market structure into a new Higher High (HH) formation.
3. Bullish targets:
6.00 → 6.80 (first resistance levels)
9.96 → 14.46 (major supply zone)
Extended targets: 21.81 – 32.27 USDT
📌 Bullish confirmation: A solid weekly close above 6.00 USDT.
---
❌ Bearish Scenario
1. Rejection from 5.3–6.0 resistance may drag price back toward the middle of the current range.
2. A decisive weekly close below 3.50 would invalidate the accumulation structure and open downside continuation:
2.70 → 2.10
Possible extension: 1.65 – 1.30 USDT (historical supports).
📌 Bearish confirmation: Consistent weekly closes below 3.50 USDT.
---
🎯 Conclusion
The 3.5–4.6 zone remains the ultimate pivot: hold = bullish potential, breakdown = deeper downside.
5.375–6.00 acts as the breakout trigger zone: clearing this level may spark a major reversal trend.
Currently, ATOM is in a long-term accumulation range, waiting for a decisive breakout.
#ATOM #Cosmos #ATOMUSDT #CryptoAnalysis #PriceAction #SupportResistance #SwingTrade #WeeklyChart
✅ Get Free Signals! Join Our Telegram Channel Here: t.me/TheCryptoNuclear
✅ Twitter: twitter.com/crypto_nuclear
✅ Join Bybit : partner.bybit.com/b/nuclearvip
✅ Benefits : Lifetime Trading Fee Discount -50%
✅ Twitter: twitter.com/crypto_nuclear
✅ Join Bybit : partner.bybit.com/b/nuclearvip
✅ Benefits : Lifetime Trading Fee Discount -50%
Disclaimer
The information and publications are not meant to be, and do not constitute, financial, investment, trading, or other types of advice or recommendations supplied or endorsed by TradingView. Read more in the Terms of Use.