1. Overall Thesis and Price Structure
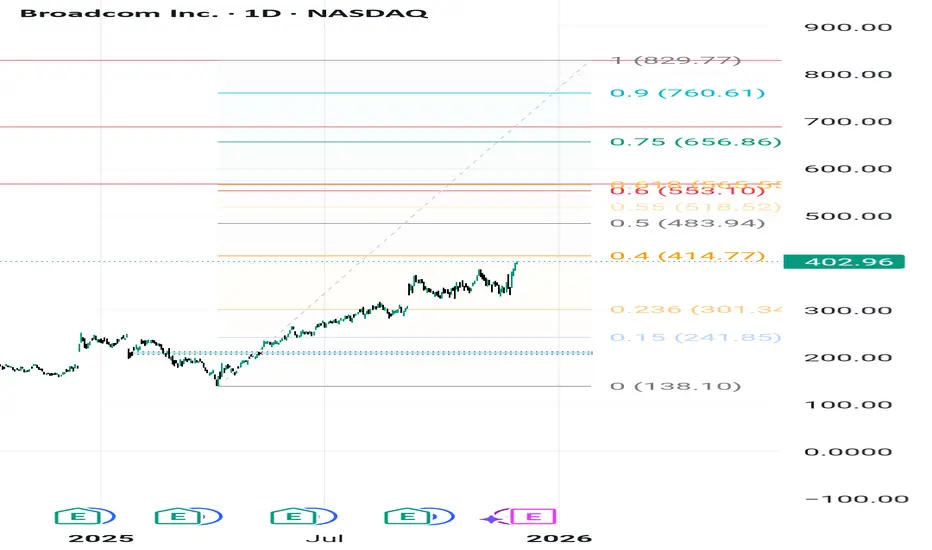
Broadcom Inc. (AVGO) exhibits a strong underlying bullish trend, fundamentally driven by demand for its AI chips and the successful integration of VMware. The technical objective targets a final high of $829.77. However, the path requires breaking through significant resistance levels defined by the Fibonacci structure. The current price is \mathbf{\$402.96}, maintaining the bullish momentum.
2. Crucial Resistance and Volatility Points
The analysis identifies two critical intermediate targets. The first and most significant hurdle is at $567.10, which aligns closely with the \mathbf{0.618} Fibonacci Golden Ratio. This zone is expected to trigger major volatility, profit-taking, and consolidation. The price action at $567.10 is the key test for trend continuity. Should the price break this level decisively, the next primary resistance target is $688.63, paving the way for the ultimate goal.
3. Key Support and Trend Invalidation
The long-term structural support, or the "Invalidation Point" for the bullish scenario, is the Key Zone at \mathbf{\$206.00}. As long as AVGO trades above this level, the multi-year uptrend remains valid. In the short term, the stock needs to overcome immediate resistance near $414.77 to gather momentum and continue its push towards the intermediate Fibonacci targets.
Disclaimer
The information and publications are not meant to be, and do not constitute, financial, investment, trading, or other types of advice or recommendations supplied or endorsed by TradingView. Read more in the Terms of Use.
Disclaimer
The information and publications are not meant to be, and do not constitute, financial, investment, trading, or other types of advice or recommendations supplied or endorsed by TradingView. Read more in the Terms of Use.