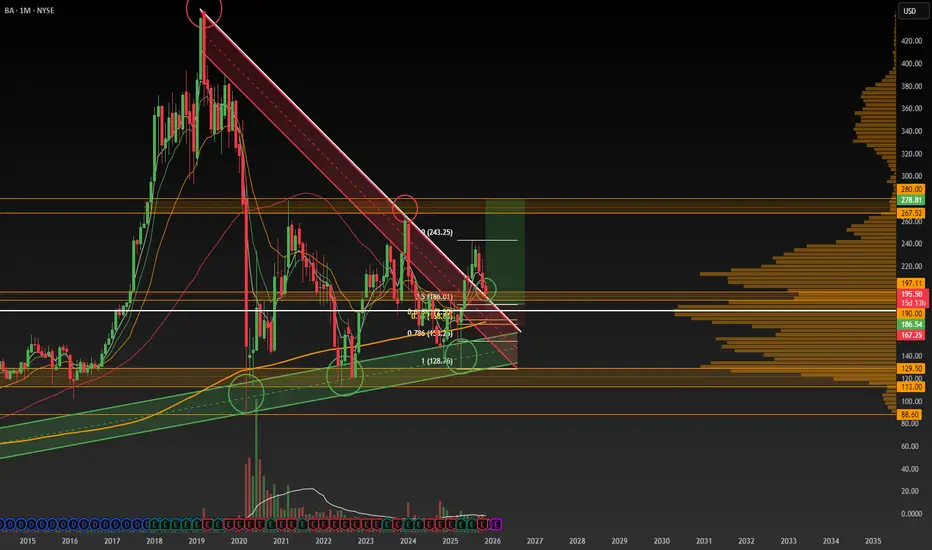
BA is not a name I typically pay attention to but I recently noticed a fairly simple monthly trade idea. Weakness caused by economic turmoil, airline delays, and a government shutdown is clearly present on the lower time frames. However, from a strictly technical perspective, this BA chart looks good on the monthly time frame if November can hold above the $190 level.
Confluences
- Strong monthly candles from April to August sparked a breakout above the MACRO downtrend that started in 2019
- It appears that a controlled monthly bull flag is forming as price retraces to the previous trend resistance channel which should now theoretically act as support
- This trend retest is occurring right around the $190 area which has acted as a key inflection level during 2020-2025 monthly range
- Price is retesting a massive volume shelf and VPOC shelf around the 190 area
Trade Idea (~5R)
- A conservative entry would wait for a monthly hold above 0.5 fib or ~$190 and the weekly 200MA to signal a December entry
- A high risk entry might scale in on the daily/weekly chart with the majority added if price wicks down into the 0.618-0.65 fib (golden pocket) which is deeper in the red resistance channel turned support. The high risk golden pocket fib entry at ~$170 would be in confluence with the center of the trend channel, the VPOC, and the monthly 200MA.
- Target previous highs at $240, $267, $280
- Look to close position after these trims into previous resistance
Thesis Is Invalidated If:
- Conservative Trader: Monthly Candle closes below $185 (tight stop)
OR
- Risky Trader: Monthly candle closes below $169 which is the golden pocket fib drawn from the April 1 lows recent swing high
Just an idea... NFA.
Disclaimer
The information and publications are not meant to be, and do not constitute, financial, investment, trading, or other types of advice or recommendations supplied or endorsed by TradingView. Read more in the Terms of Use.
Disclaimer
The information and publications are not meant to be, and do not constitute, financial, investment, trading, or other types of advice or recommendations supplied or endorsed by TradingView. Read more in the Terms of Use.