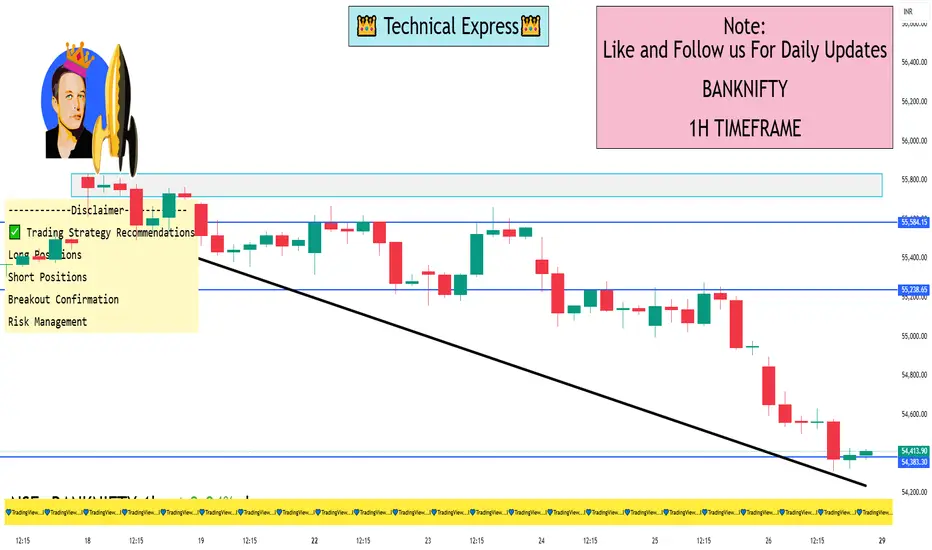
📊 Bank Nifty 1-Hour Time Frame Analysis
🔹 Current Market Snapshot
Closing Price (Sep 26, 2025): ₹54,389.35
Day's Range: ₹54,310.95 – ₹54,897.00
52-Week Range: ₹47,702.90 – ₹57,628.40
Trend: Neutral
🔹 Key Support and Resistance Levels
Opening Support/Resistance Zone: ₹54,935 – ₹54,971
Immediate Resistance: ₹55,167
Last Intraday Resistance: ₹55,368
Last Intraday Support: ₹54,698
Deeper Support: ₹54,545
🔹 Market Scenarios
Gap-Up Opening (200+ points):
A gap-up above ₹55,150–₹55,200 will immediately test the Opening Resistance at ₹55,167. Sustaining above this zone may extend the rally towards the last intraday resistance at ₹55,368.
A breakout above ₹55,368 could invite further bullish momentum.
However, if Bank Nifty fails to hold above ₹55,167, it may retrace back to the support zone around ₹54,971.
Educational Note: Gap-ups often invite early profit booking. Always confirm sustainability above resistance levels before initiating aggressive long trades.
Flat Opening (within ±200 points):
A flat start near ₹54,900–₹55,000 means Bank Nifty will trade directly around the Opening Support/Resistance Zone (₹54,935 – ₹54,971).
Holding above ₹54,971 will give buyers confidence to push towards ₹55,167 → ₹55,368.
A failure to sustain above this zone may drag the index down towards ₹54,698 and possibly ₹54,545.
Educational Note: Flat openings provide clearer setups as price tests both support and resistance zones naturally, giving traders better confirmation of direction.
Gap-Down Opening (200+ points):
A gap-down below ₹54,750 will put immediate pressure on Bank Nifty, exposing the Last Intraday Support at ₹54,698.
Use hourly candle close for stop-loss confirmation to prevent whipsaws.
Avoid naked options in high volatility; instead, use spreads (like Bull Call or Bear Put spreads) to limit premium decay.
Maintain a strict 1:2 risk-to-reward ratio.
Never chase trades out of emotion. Scale into trades gradually rather than going all-in at once.
📈 Technical Indicators Overview
Trend: Neutral
Moving Averages: Not specified
RSI (Relative Strength Index): Not specified
MACD (Moving Average Convergence Divergence): Not specified
Stochastic Oscillator: Not specified
Volume: Not specified
✅ Trading Strategy Recommendations
Long Positions: Consider initiating long positions if Bank Nifty sustains above ₹55,167, with a target towards ₹55,368.
Short Positions: Be cautious of short positions unless a clear breakdown below ₹54,698 is observed, with a subsequent target towards ₹54,545.
Breakout Confirmation: Always wait for confirmation (e.g., a 15-minute close) above or below key levels before entering trades.
Risk Management: Employ stop-loss orders to protect against adverse market movements.
I built a Buy & Sell Signal Indicator with 85% accuracy.
📈 Get access via DM or
WhatsApp: wa.link/d997q0
Contact - +91 76782 40962
| Email: techncialexpress@gmail.com
| Script Coder | Trader | Investor | From India
📈 Get access via DM or
WhatsApp: wa.link/d997q0
Contact - +91 76782 40962
| Email: techncialexpress@gmail.com
| Script Coder | Trader | Investor | From India
Related publications
Disclaimer
The information and publications are not meant to be, and do not constitute, financial, investment, trading, or other types of advice or recommendations supplied or endorsed by TradingView. Read more in the Terms of Use.