Bank Nifty Trading Plan for 03-Dec-2024
Previous Day’s Chart Pattern Analysis:
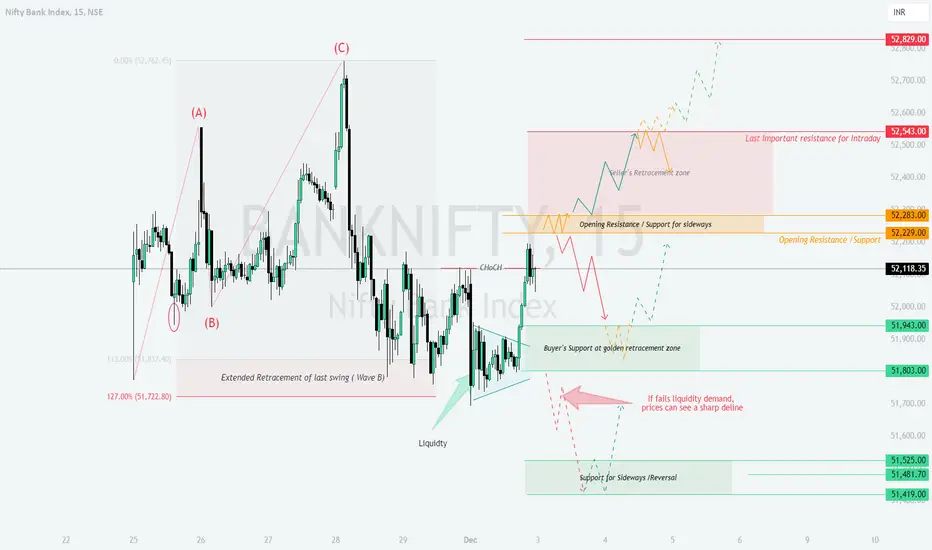
BANKNFITY has a strong strong form extended retracement zone of Wave B of last swing structure and managed to close near day's high after mitigating liquidity form the levels mentioned in yesterdays plan. The chart highlights a liquidity grab at lower levels, followed by a rally towards 52,229 Opening Resistance/Support Zone, indicating bullish intent. Yellow lines represent consolidation phases, green lines signal bullish trends, and red lines indicate bearish declines. The levels of 52,543 and 51,943 played a critical role in shaping the market sentiment.
For next session, expect dynamic movements around these levels based on opening scenarios.
Opening Scenarios for 03-Dec-2024:
Risk Management Tips for Options Trading:
Always define your risk before entering a trade. Risk no more than 1-2% of your capital on a single trade.
Use hedging strategies like bull call spreads or bear put spreads to limit potential losses.
During high volatility, prefer index options over individual stocks for better liquidity.
Summary and Conclusion:
Key levels to watch today are 52,543, 52,283, and 51,943.
Bullish scenario: Sustained movement above 52,543 could lead to targets of 52,829.
Bearish scenario: Breaking below 51,803 may trigger a slide towards 51,525.
Sideways scenario: Expect consolidation between 52,229 and 51,943, with trading opportunities emerging on breakouts or breakdowns.
Disclaimer:
I am not a SEBI-registered analyst. This trading plan is for educational purposes only. Please conduct your own analysis or consult a financial advisor before making any trading decisions.
Previous Day’s Chart Pattern Analysis:
BANKNFITY has a strong strong form extended retracement zone of Wave B of last swing structure and managed to close near day's high after mitigating liquidity form the levels mentioned in yesterdays plan. The chart highlights a liquidity grab at lower levels, followed by a rally towards 52,229 Opening Resistance/Support Zone, indicating bullish intent. Yellow lines represent consolidation phases, green lines signal bullish trends, and red lines indicate bearish declines. The levels of 52,543 and 51,943 played a critical role in shaping the market sentiment.
For next session, expect dynamic movements around these levels based on opening scenarios.
Opening Scenarios for 03-Dec-2024:
- Scenario 1: Gap Up Opening (200+ Points Above 52,118)
If Bank Nifty opens above 52,318, focus on the immediate resistance zone at 52,543 Seller's Retracement Zone.
- Action Plan:
- If the price sustains above 52,543, initiate long trades targeting the 52,829 Last Important Resistance for Intraday. Maintain a stop-loss at 52,283 Opening Resistance/Support Zone.
- Failure to sustain above 52,543 may lead to a pullback towards 52,283. Observe price action here before considering short trades targeting 52,229.
- Risk Management Tip: Avoid aggressive entries near the opening bell. Wait for a retest of key levels to confirm direction. Use call spreads for upside momentum.
- Scenario 2: Flat Opening (Near 52,118)
In the case of a flat opening, monitor the 52,229 Opening Resistance/Support Zone for price action.
- Action Plan:
- If the price decisively breaks above 52,283, go long with targets of 52,543 and then 52,829. Place a stop-loss at 52,118.
- A failure to hold 52,229 could see the index retest 51,943 Buyer's Support at Golden Retracement Zone. Short positions can be considered with a target of 51,803, keeping a stop-loss at 52,283.
- Risk Management Tip: Wait for the first 30 minutes to let the trend stabilize. Use protective puts or hedged positions during flat openings.
- Scenario 3: Gap Down Opening (200+ Points Below 52,118)
A gap-down opening below 51,943 would bring the 51,803 Support Zone into focus.
- Action Plan:
- If the price finds support at 51,803, expect a bounce towards 51,943. Go long with a stop-loss at 51,525 Support for Reversal.
- Breaching 51,803 might lead to sharp declines, targeting 51,525 and 51,419 Extended Retracement of Last Swing. Short positions can be initiated below 51,803 with tight stop-losses above 51,943.
- Risk Management Tip: Use out-of-the-money puts for bearish momentum. Avoid oversizing positions in volatile conditions.
Risk Management Tips for Options Trading:
Always define your risk before entering a trade. Risk no more than 1-2% of your capital on a single trade.
Use hedging strategies like bull call spreads or bear put spreads to limit potential losses.
During high volatility, prefer index options over individual stocks for better liquidity.
Summary and Conclusion:
Key levels to watch today are 52,543, 52,283, and 51,943.
Bullish scenario: Sustained movement above 52,543 could lead to targets of 52,829.
Bearish scenario: Breaking below 51,803 may trigger a slide towards 51,525.
Sideways scenario: Expect consolidation between 52,229 and 51,943, with trading opportunities emerging on breakouts or breakdowns.
Disclaimer:
I am not a SEBI-registered analyst. This trading plan is for educational purposes only. Please conduct your own analysis or consult a financial advisor before making any trading decisions.
Disclaimer
The information and publications are not meant to be, and do not constitute, financial, investment, trading, or other types of advice or recommendations supplied or endorsed by TradingView. Read more in the Terms of Use.
Disclaimer
The information and publications are not meant to be, and do not constitute, financial, investment, trading, or other types of advice or recommendations supplied or endorsed by TradingView. Read more in the Terms of Use.