BITM – Symmetrical Triangle Breakout Setting Up for a Potential
BitMine Immersion Technologies (NYSE: BITM) is showing a classic symmetrical triangle pattern on the daily chart — a consolidation that often precedes a major directional breakout.
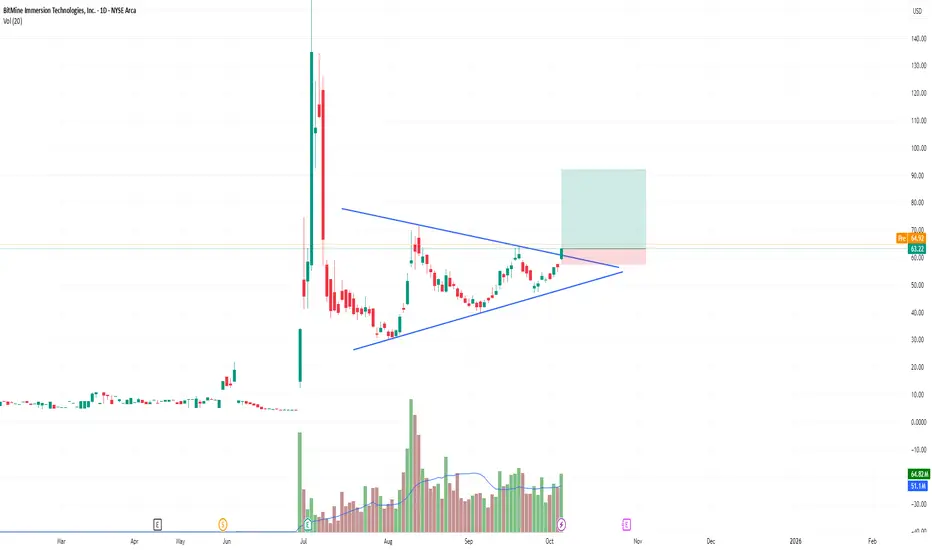
After the explosive move in July that sent the stock from the $10s to above $130, price has been cooling off and forming lower highs and higher lows. This compression has now reached its apex, with today’s candle showing a clean breakout attempt above the descending trendline.
🔍 Technical Overview
Pattern: Symmetrical Triangle
Breakout Zone: Around $63–65
Volume: Noticeably increasing on the breakout day, confirming participation
Next Resistance: The $80–90 zone (midpoint of previous selloff)
Support: Triangle base near $55
📈 Trade Plan
Entry: $63–65 (confirmed breakout with volume)
Stop-Loss: Below $55 (triangle support)
Target: $90+ (measured move projection from the height of the pattern)
Risk/Reward: Around 3:1
💡 Why It Matters
BITM operates in the immersive cooling and crypto mining infrastructure space, which tends to gain momentum during crypto market upswings. The technical breakout aligns with renewed sector interest and volume inflows.
If bulls maintain this strength and confirm the breakout with a daily close above the trendline, this could be the start of a new momentum wave toward the $90–100 region.
Disclaimer
The information and publications are not meant to be, and do not constitute, financial, investment, trading, or other types of advice or recommendations supplied or endorsed by TradingView. Read more in the Terms of Use.
Disclaimer
The information and publications are not meant to be, and do not constitute, financial, investment, trading, or other types of advice or recommendations supplied or endorsed by TradingView. Read more in the Terms of Use.