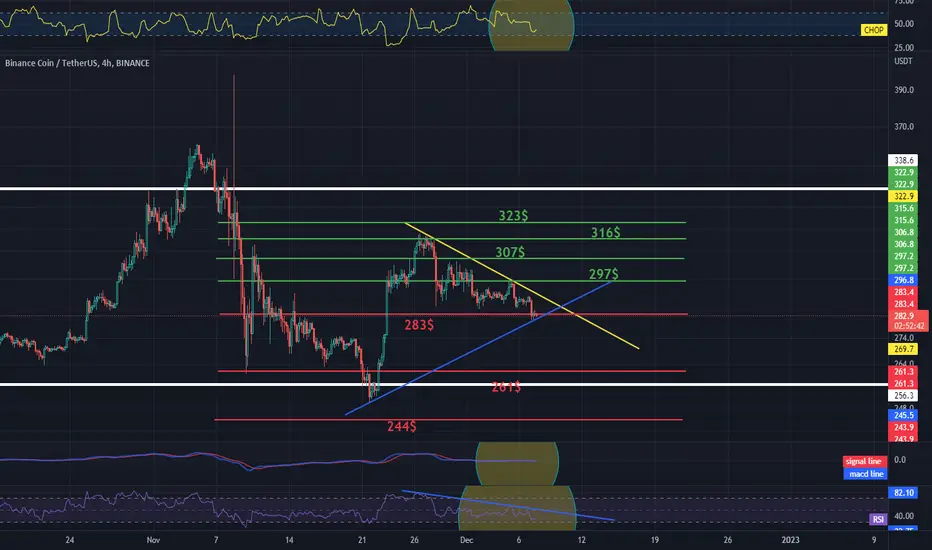
Second in today's review is the BNB chart on a four-hour time frame. At the beginning, we can mark with the white lines the sideways trend channel in which the price is moving and with the yellow line the local downtrend line we are under.
Now, using the Trend-Based Fib Extension tool, let's check what support we have in the coming hours and days, as you can see, the first support on which the price is currently based is $ 283, but if it drops below, we have another support at $ 261 and the third at $ 244 .
Looking the other way, we can check in the same way what resistances the price has to overcome first, and as you can see, we have the first resistance at $297, the second at $307, the third at $316 and the fourth at $323.
As we can see, the CHOP index indicates that most of the energy in the four-hour interval has been used up, the MACD indicates entering a local downtrend, while the RSI is at the lower end of the range from which the price often starts to reverse. At this point, it is also worth marking the opposite directions on the chart and the RSI indicator with a blue line, such an arrangement often indicates a change in the trend.
Disclaimer
The information and publications are not meant to be, and do not constitute, financial, investment, trading, or other types of advice or recommendations supplied or endorsed by TradingView. Read more in the Terms of Use.
Disclaimer
The information and publications are not meant to be, and do not constitute, financial, investment, trading, or other types of advice or recommendations supplied or endorsed by TradingView. Read more in the Terms of Use.