TradeCityPro | BNB: Analyzing Its Position in the Crypto Titans👋 Welcome to TradeCity Pro!
From today, we're returning to our usual routine on the channel, where we will provide two altcoin analyses and one Bitcoin analysis daily.
🔍 In this analysis, I want to review the BNB coin for you. It's one of the most important cryptocurrencies, with a market cap of $84 billion, ranking 5th in CoinMarketCap.
👀 This coin is officially for Binance exchange and is part of the projects that are profiting from the crypto space with a positive balance sheet. Let’s technically analyze this coin as well.
📅 Weekly Timeframe
In the weekly timeframe, as you can see, there is a very large range box from 208 to 662 where the price has been moving since 2021.
💫 Currently, in the last leg where the price moved, it was supported at the area of 208 and began to form a base, then after breaking 352, it started an upward movement up to the resistance area of 662 to 746.
✔️ After reaching this area, a corrective and resting phase of the price began, and a box has formed between this area and the 501 area. The 501 area overlaps with the 0.236 Fibonacci, making it a very important PRZ for BNB.
❌ If you already own BNB, you can set your stop loss if the price consolidates below the 501 area because if this area is broken, the next significant support the price has is the 352 area, which is the most crucial support in this trend and overlaps with the golden Fibonacci area, and a fall to this area could happen.
🛒 For buying in spot, first of all, you must wait until buying volume enters the market so that the price can move upwards. The main trigger for spot is the break of 746, and if this area is broken, the main upward trend can start because the box that the price has built since 2021 will also be broken.
💥 Let’s move to the daily timeframe to analyze the price movement in the short term.
📅 Daily Timeframe
In this timeframe, we also have a range box from 484 to 750, and in this leg, an expanding triangle has formed, which causes the market volatility to increase and the price to show less reaction to static areas.
⭐ On the other hand, because we have a range box and the price is ranging, we can't rely much on indicators and oscillators because they give us incorrect data.
🎲 In this market condition, we shouldn't check too much data and unnecessarily clutter the chart. For a long position, you can enter with the break of the 638 area. It would be better if this break occurs simultaneously or after the triangle break, allowing for more risk.
🔼 The main trigger for buying in spot, as mentioned in the weekly timeframe, is 746, which becomes 750 in this timeframe, and you can proceed with your spot purchase if this area is broken.
📉 For short positions and in general for a bearish scenario, the first trigger is 569, which is a very risky trigger, and in my opinion, we should wait for the price to react to it to be sure of the exact place of this area.
✨ The next triggers are 531 and 484, where 531 is a logical trigger and 484 is the main trigger for a trend change in the large market cycle.
📝 Final Thoughts
This analysis reflects our opinions and is not financial advice.
Share your thoughts in the comments, and don’t forget to share this analysis with your friends! ❤️
BNB

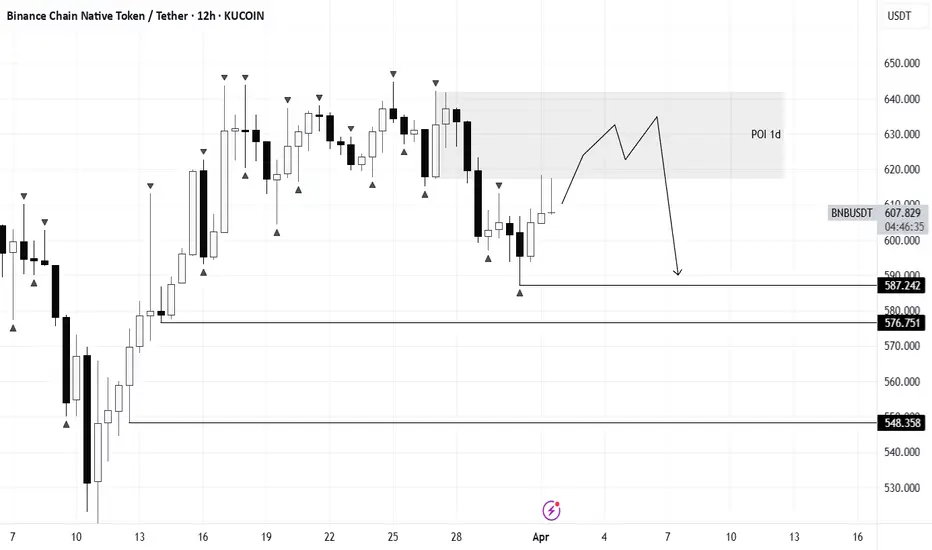
BNB/USDTI marked the area from which we can get a reaction. If it is passed, it will act as a support zone.
Target 1 = 587
Target 2 = 576
Target 3 = 548

BNBUSDT | Key Support & Resistance Zones – Trade With PrecisionThe blue box that I gave as resistance 5 days ago gave 8% profit right from the blue box.
Now I think Red Lines has to should be carefully used for shorts.
🔹 %80 Daily Volume Spike – This means we are dealing with a highly active setup, making it one of the most crucial trades of the day. Smart traders focus on high-volume movers, and that’s exactly why we’re here.
Now, I still stand by my analysis and expect the lower blue box below to act as strong support.
🔴 Short Scenario (Red Line Rejections):
✔️ If price rejects from the red lines with LTF breakdowns, I will look for short opportunities.
✔️ CDV & Volume Footprint Confirmations – We need sellers to step in aggressively before considering entries.
✔️ The market respects precision, not emotions. No confirmation = no trade.
🟢 Long Scenario (Regaining Red Lines):
✔️ If price breaks above the red lines with strong volume and successfully retests them as support, I will switch to a long bias.
✔️ LTF Confirmations Are Key – Without a proper reclaim, there’s no reason to rush longs.
Why My Levels Matter
This isn’t just a random setup—my levels are based on deep market insights that most traders don't even understand. That’s why my success rate speaks for itself.
The market is not a guessing game—it’s a battlefield where only the well-prepared win. I provide the roadmap, it’s up to you to execute.
📌I keep my charts clean and simple because I believe clarity leads to better decisions.
📌My approach is built on years of experience and a solid track record. I don’t claim to know it all but I’m confident in my ability to spot high-probability setups.
📌If you would like to learn how to use the heatmap, cumulative volume delta and volume footprint techniques that I use below to determine very accurate demand regions, you can send me a private message. I help anyone who wants it completely free of charge.
🔑I have a long list of my proven technique below:
🎯 ZENUSDT.P: Patience & Profitability | %230 Reaction from the Sniper Entry
🐶 DOGEUSDT.P: Next Move
🎨 RENDERUSDT.P: Opportunity of the Month
💎 ETHUSDT.P: Where to Retrace
🟢 BNBUSDT.P: Potential Surge
📊 BTC Dominance: Reaction Zone
🌊 WAVESUSDT.P: Demand Zone Potential
🟣 UNIUSDT.P: Long-Term Trade
🔵 XRPUSDT.P: Entry Zones
🔗 LINKUSDT.P: Follow The River
📈 BTCUSDT.P: Two Key Demand Zones
🟩 POLUSDT: Bullish Momentum
🌟 PENDLEUSDT.P: Where Opportunity Meets Precision
🔥 BTCUSDT.P: Liquidation of Highly Leveraged Longs
🌊 SOLUSDT.P: SOL's Dip - Your Opportunity
🐸 1000PEPEUSDT.P: Prime Bounce Zone Unlocked
🚀 ETHUSDT.P: Set to Explode - Don't Miss This Game Changer
🤖 IQUSDT: Smart Plan
⚡️ PONDUSDT: A Trade Not Taken Is Better Than a Losing One
💼 STMXUSDT: 2 Buying Areas
🐢 TURBOUSDT: Buy Zones and Buyer Presence
🌍 ICPUSDT.P: Massive Upside Potential | Check the Trade Update For Seeing Results
🟠 IDEXUSDT: Spot Buy Area | %26 Profit if You Trade with MSB
📌 USUALUSDT: Buyers Are Active + %70 Profit in Total
🌟 FORTHUSDT: Sniper Entry +%26 Reaction
🐳 QKCUSDT: Sniper Entry +%57 Reaction
📊 BTC.D: Retest of Key Area Highly Likely
📊 XNOUSDT %80 Reaction with a Simple Blue Box!
📊 BELUSDT Amazing %120 Reaction!
I stopped adding to the list because it's kinda tiring to add 5-10 charts in every move but you can check my profile and see that it goes on..

BNBUSD - Up Trend TouchUp trend in blue that is currently being tested, i expect a strong bull move off this up trend line
Using the dotted white line an ascending triangle can be plotted
This is the daily chart for BNB

BNB AnalysisBinance Coin (BNB) Analysis – March 30, 2025
In today's analysis, we examine Binance Coin's price movements using the 4-hour timeframe to assess its potential future direction.
🔹 Key Support Levels:
BNB remains above a crucial support range of $607–$593, which has held since March 16. If this support breaks, the price may test $546 as the next reaction level. Further downside could see BNB dropping to $530 and $507 as additional support zones.
🔹 Key Resistance Levels:
On the upside, BNB faces resistance at $637–$644. A confirmed breakout above this zone could push the price toward $700, following the same price range projection method used for support breakdowns.
📌 Outlook:
BNB’s trend remains neutral as long as the key support holds. A break below $593 could trigger a bearish move, while a break above $644 may confirm a bullish trend with $700 as the next target.

WHY EURUSD IS BULLISH ?? DETAILED FUNDAEMTALS AND TECHNICAL EUR/USD is currently trading around 1.0880, exhibiting a bullish trend after completing a retest within the 0.50 to 0.61 Fibonacci retracement levels. This technical formation suggests a potential upward movement toward the target price of 1.1000, indicating strong support and the possibility of continued appreciation.
Fundamentally, the euro has shown resilience despite recent dovish signals from the European Central Bank (ECB). ECB board member Piero Cipollone has advocated for further policy easing, citing declining inflation and economic shifts as justifications for additional interest rate cuts. Conversely, the U.S. dollar has experienced modest gains amid uncertainties surrounding potential tariffs and mixed economic data, contributing to its volatility. These dynamics create a nuanced environment where the euro's strength may persist in the short term
Technical analysis reinforces the bullish outlook for EUR/USD. The pair's rebound from the 0.50 to 0.61 Fibonacci retracement levels indicates robust support, with the recent completion of the retest phase suggesting readiness for further ascent. Key resistance levels to monitor include 1.0945, with a sustained break above this point potentially paving the way toward the 1.1000 target. Indicators such as the Relative Strength Index (RSI) and moving averages also support the continuation of the upward trend
Traders should remain vigilant regarding upcoming economic releases and central bank communications, as these can significantly influence market sentiment and price action. Implementing sound risk management strategies, including appropriate stop-loss orders, is essential to navigate potential volatility. By staying informed and adaptable, traders can effectively capitalize on the anticipated bullish movement in the EUR/USD pair.

BNB/USDT – Bullish Channel Breakout in Play?
#BNB/USDT #Analysis
Description
---------------------------------------------------------------
📉 Pair: BNB/USDT (Binance, 1W Chart)
📊 Analysis by: VectorAlgo
Binance Coin (BNB) has been trading within a well-defined ascending channel, showing strong bullish momentum since mid-2023. The price is currently near the mid-range of the channel and is attempting to push higher.
- Ascending Channel: BNB is trending upwards, respecting both support and resistance levels within this channel.
- Moving Averages: The price is holding above key EMAs, reinforcing bullish sentiment.
- Potential Upside Target: If the trend continues, the next major resistance could be between $900–$1,100.
- Support Levels: If a pullback occurs, watch for support near $500–$550 as a potential buy zone.
Long Entry: Dips into the lower trendline (~$550) could be buying opportunities.
Breakout Play: If BNB clears the mid-channel resistance around $730, a move toward $900+ is likely.
Risk Management: A breakdown below the channel (~$500) could invalidate the bullish setup.
📢 What’s Your Outlook?
Is BNB heading toward new highs, or will we see a deeper pullback? Drop your thoughts below!
---------------------------------------------------------------
Enhance, Trade, Grow
---------------------------------------------------------------
Feel free to share your thoughts and insights. Don't forget to like and follow us for more trading ideas and discussions.
Best Regards,
VectorAlgo

Technical and Statistical Time-Series Analysis for Bitcoin (BTC)Technical and Statistical Time-Series Analysis for Bitcoin (BTC) 📈
Bitcoin is currently trading around $82,000, having breached the critical support level at $80,548. This breakdown, combined with a potential daily close below this level, indicates a likelihood of accelerated downward momentum towards the corrective cycle's end target of $71,823. This target is anticipated to be reached within a short timeframe, between April 9th and 11th.
Price Movement Predictions : 🔮
March 30th - 31st:
A price rebound from $80,548 to $85,098 is expected, serving as a retest. Any rejection from the $85,098 range will signal a continuation of the corrective downtrend. 📉
March 31st - April 10th:
Continuation of the downward cycle is anticipated, targeting the following levels:
First Target: $76,123 🎯
Second Target: $71,823 🎯
April 11th or 12th:
A potential trend reversal towards a strong uptrend is foreseen. 🚀
Invalidation of the Scenario : ⚠️
This scenario will be invalidated if the price breaks above and closes above $90,000. This breakout and close, especially if sustained for three consecutive days, would signal the end of the correction and the resumption of the uptrend towards a new peak. 🔝
Notes : 📝
These predictions are based on technical analysis and do not constitute investment advice. 🚫
The cryptocurrency market is highly volatile, and trading involves significant risk. Proceed with caution. 🚨
It is very important to pay close attention to the economic market news, that can change any technical analysis. 📰

Technical and Statistical Time-Series Analysis For Dominan (BTC)Bitcoin dominance is currently at 62.24%, a level it has reached during the latest bullish wave in a three-year continuous uptrend. This coincides with the formation of an all-time high in the recent fifth wave.
Current Situation Analysis:
Bitcoin Dominance Level: Bitcoin dominance indicates the percentage of control Bitcoin investors hold. When Bitcoin dominance is high (as it is here at 62%), it signifies that Bitcoin investors control the market, supporting the uptrend. 📈
Uptrend: The three-year continuous bullish wave indicates the strength of the current trend. 🚀
Fifth Wave: In Elliott wave theory, the fifth wave often represents the end of an uptrend. Therefore, the formation of an all-time high in this wave may indicate an approaching trend reversal. 📉
Predictions:
The market may target the 65.70% level before it begins to reverse. 🎯
A daily close below the 60.30% level may signal the beginning of a change in the uptrend, with an initial target at 52.5%. 📉
Notes:
Technical analysis is one tool among many used by traders and investors. 📊
Bitcoin dominance analysis is part of the market analysis tools that contribute to decoding trades. 🔍
Financial markets are volatile and cannot be predicted with absolute accuracy. ⚠️
Recommendations:
Monitor the mentioned support and resistance levels (65.80%, 60.30%, and 52.5%). 👀
Use other technical analysis tools to confirm signals. ✅
Consider other factors that may affect the market, such as economic news and political events. 📰
Always exercise caution in trading. 🚨

MUBARAKUSDT Hourly Technical AnalysisMUBARAKUSDT Hourly Technical Analysis
Mubarak Coin is currently in a recovery phase after being affected by Bitcoin’s decline. After forming support at 0.1288, it has reached the 0.1381 resistance level. At this level, it appears very close to the 21-day moving average. If it manages to stay above this average, the 0.1527 resistance level can be monitored. Indicators are currently in a positive state.
This meme coin is supported by CZ. It is currently being voted on for listing on the Binance exchange. While supporting this meme coin, CZ has been seen posting on his social media accounts wearing the traditional Arab attire featured in the coin’s symbol. In short, since there is a possibility that the MUBARAK coin may be listed on Binance in the future, the likelihood of positive price movements is high.
NOT FINANCIAL ADVICE
The information, comments, and recommendations provided here do not constitute investment advice. Investment advisory services are provided within the framework of an investment advisory agreement signed between clients and brokerage firms, portfolio management companies, or banks that do not accept deposits. The statements on this page reflect only personal opinions. These opinions may not be suitable for your financial situation, risk tolerance, or investment preferences. Therefore, no investment decisions should be made based on the information and statements on this page.
To avoid missing our analyses on positive or risky technical indicators, follow and like us—we would appreciate your support!

Be careful with BNB !!!the price can form a head and shoulders pattern. If that is happen, expect a significant price increase.
Give me some energy !!
✨We spend hours finding potential opportunities and writing useful ideas, we would be happy if you support us.
Best regards CobraVanguard.💚
_ _ _ _ __ _ _ _ _ _ _ _ _ _ _ _ _ _ _ _ _ _ _ _ _ _ _ _ _ _ _ _
✅Thank you, and for more ideas, hit ❤️Like❤️ and 🌟Follow🌟!
⚠️Things can change...
The markets are always changing and even with all these signals, the market changes tend to be strong and fast!!

BNB - New Higher High is formingBINANCE:BNBUSDT (1W CHART) Technical Analysis Update
BNB is currently trading at $639 and showing overall bullish sentiment. Price is trading inside the channel and new Higher High is expected to formed soon if this bullish trend continues.
Entry level: $639
Stop Loss Level: $
TakeProfit 1: $685
TakeProfit 2: $750
TakeProfit 3: $850
TakeProfit 4: $900
TakeProfit 5: $999
Max Leverage: 2x
Position Size: 1% of capital
Remember to set your stop loss.
Follow our TradingView account for more technical analysis updates. | Like, share, and comment your thoughts.
Cheers
GreenCrypto

MUBARAKUSDT Hourly Technical AnalysisMUBARAKUSDT Hourly Technical Analysis
Mubarak Meme Coin has shown a positive breakout in the 1-hour technical analysis, breaking above the 0.13552 resistance level. Currently, it has broken above the 0.15057 resistance and surged up to 0.16595 resistance, increasing the risk of potential profit-taking sales. If profit-taking occurs, a pullback towards the 21-day price average (around 0.45057) may happen. Indicators are at peak levels, and slight downward movements in a partially negative direction can be observed.
Changpeng Zhao (CZ) still supports this coin. A vote is currently ongoing for its listing on Binance, and the results will be announced soon. This movement is creating a positive sentiment for now. If the listing vote results are positive, it could positively impact the price.
NOT INVESTMENT ADVICE.
The information, comments, and recommendations provided here do not constitute investment advice. Investment advisory services are offered within the framework of an agreement between clients and brokerage firms, portfolio management companies, and non-deposit banks. The content on this page reflects only personal opinions. These views may not be suitable for your financial situation, risk tolerance, or return preferences. Therefore, investments should not be made based on the information and writings on this page.
To avoid missing our analyses of both positive and risky technical indicators, follow us and like our content—we would appreciate it!

what do you think about Bitcoin's performance todayHey friends 👋, what do you think about Bitcoin's performance today and what's happening in the crypto market? 🤔
From my point of view, and as we've explained before, there's a minor correction during the uptrend, especially since Bitcoin's dominance showed a noticeable rise after breaking the uptrend line two days ago on March 24th 📈 and is now climbing again. This is actually very healthy and normal 🧘♂️, and on the contrary, I see the market behaving in a balanced and logical way.
The rule says in all markets, before any rise, there must be a drop to attract liquidity and new buyers 💸. All these are temptations to enter, so I'm very, very optimistic about what's coming next 🚀.
Bitcoin faced fierce resistance around the 88,000 - 88,500 levels and couldn't close positively and fully on the daily timeframe 🛑, so expect it to move in accumulation zones for a period of time, maybe a week or two ⏳. After that, we'll see a good correction scenario, and then let's head to the moon 🌙 at 114,000 - 120,000.
What do you think of this detailed analysis, friends? I'm waiting for your opinions to share our experiences with everyone in this wonderful market 💬.

explained regarding Bitcoin's dominanceAs I previously explained regarding Bitcoin's dominance, the trendline was broken on March 24th 📉, indicating a bearish signal on the daily timeframe. However, today it has rebounded and re-entered the line, signaling a bullish trend 📈. If it breaks through the 62.23% level, even with a wick, it would be a strong indicator of continued upward momentum 🚀, potentially delaying the altcoin season by a month or more ⏳.
The second scenario is that it tests this area and bounces back down, which would be very favorable for the altcoin season and the bull run 🐂. Therefore, I urge everyone to watch closely 👀 and avoid making hasty decisions 🙅♂️. We want to prevent any failed trades due to impulsive actions 💥.
I'd also love to hear your thoughts, my friends! Please share your opinions in the comments below 🗣️. We need to discuss various ideas 💡 together.

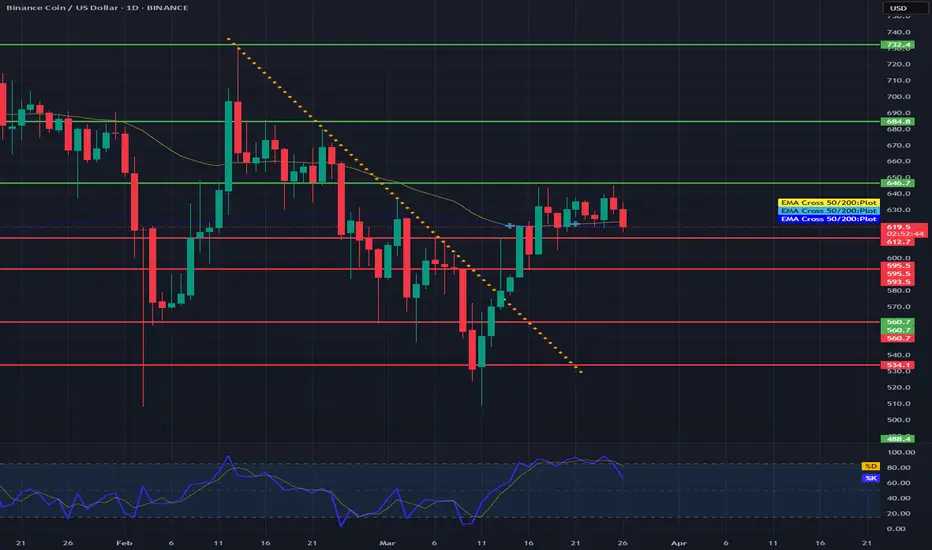
BNB before correction?Hello everyone, let's look at the 1D BNB to USD chart, in this situation we can see how the price came out of the downtrend line, however, here it is worth observing the EMA Cross 50 and 200 indicator, which shows a fight to maintain the uptrend. Please take into account the STOCH indicator, which shows a longer movement at the upper limit of the range, which may confirm the current rebound and give a deeper correction, however, here it is important for the price to stay above the level of the last low.
Let's start by defining the goals for the near future, which the price must face:
T1 = 646 USD
T2 = 684 USD
Т3 = 732 USD
Now let's move on to the stop-loss in case the market continues to fall:
SL1 = 612 USD
SL2 = 595 USD
SL3 = 560 USD
SL4 = 534 USD
BNB: Navigating the Current DipBNB: Navigating the Current Dip 📉🔍
The crypto market is always in flux, and right now, BNB is showing signs of a downward trend. However, it's not all doom and gloom. Let's break down the situation.
The Current Scenario 📉:
BNB is currently experiencing a downward trajectory. Despite this, it's crucial to acknowledge that the coin has maintained a pattern of higher lows and higher highs. This suggests that the current dip might be a temporary sideways correction before BNB aims for the $650 mark in the near future.
Key Technical Analysis 📊:
Fibonacci Levels: BNB is currently within the Fibonacci retracement levels of $629.7 to $638.6. These levels are significant indicators of potential support and resistance.
Support and Resistance:
A strong support level has been observed at $630.9.
Potential resistance is identified at $637.2.
Statistical Analysis: This analysis is based on robust statistical modeling, specifically the VAR (Vector Autoregression) model, which helps in understanding the interdependencies between multiple time series data. This adds a layer of reliability to the prediction.
Understanding the Trends 🤔:
The fact that BNB is maintaining the pattern of higher lows and higher highs indicates that the overall bullish trend might still be intact. The current dip could be a temporary phase of consolidation before the next upward surge.
The $650 Target 🎯:
The analyst predicts that BNB is likely to aim for the $650 price point in the near term. This prediction is based on the analysis of current trends and historical data.
The Next 12 Hours ⏳:
The next 12 hours are critical. We'll be closely monitoring how BNB interacts with the identified support and resistance levels. Any significant break above or below these levels could indicate the direction of the next major move.
Important Considerations ⚠️:
The crypto market is highly volatile.
Always conduct your own research before making any investment decisions.
Market fluctuations are possible.
In Conclusion 🌟:
While BNB is currently on a downward trend, the overall outlook remains cautiously optimistic. The identified support and resistance levels, combined with the statistical analysis, provide valuable insights into potential future movements. Let's keep a close eye on BNB in the next 12 hours to see how things unfold.
I hope this breakdown provides a clear picture of the current BNB situation! 🚀
What do you think, friends?

Magic of statistical models and mathematics Hey everyone! 👋 I wanted to share some of the magic of statistical models and mathematics with you. ✨ Check out how price reacts to Fibonacci levels, those levels are determined by using the VAR statistical model. 📊
It's amazing how numbers and patterns can reveal hidden insights in the market! It's like watching a secret code unfold right before our eyes. 🤩 The way price respects those Fibonacci levels is truly fascinating. It's a testament to the power of these models and the beauty of mathematics. 🤓
Enjoy the show! 🍿

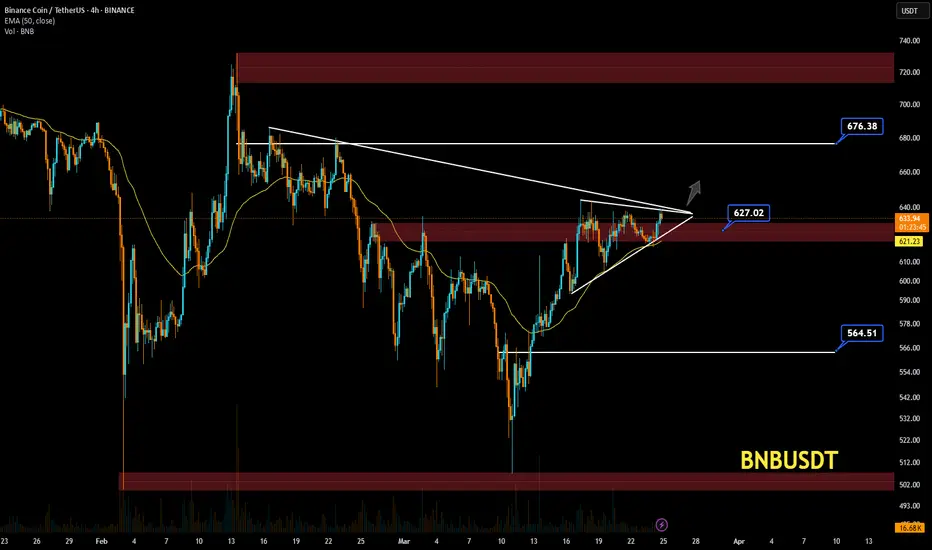
BNBUSD BNBUSD Price Action Analysis – 4H Timeframe 📊🔥
Market Structure:
The chart shows a symmetrical triangle pattern forming, with the price approaching a breakout. 📈🔺
Supply and demand zones are marked with red boxes, indicating key levels for reaction. 🟥
The price is currently testing the $627.02 resistance level. 🚀
Trend Analysis:
A Higher Low (HL) was recently formed at $564.51, maintaining the bullish trend. 🔼
The 50 EMA at $621.21 acts as a strong dynamic support. 📉
Increasing volume suggests a potential breakout. 📊
Key Levels:
Resistance:
The $627.02 - $630 area is a critical supply zone. If broken, the next target would be $676.38. 🎯
A breakout above this level could confirm strong bullish momentum. 🟢
Support:
The $621.21 level, aligning with the 50 EMA, serves as a key support. 📉
If this level breaks, a potential decline toward $564.51 is possible. ⚠️
Possible Scenarios:
🔹 Bullish Case: A confirmed breakout above $627 could push the price toward $676. 🚀
🔹 Bearish Case: Rejection from resistance and a break below $621 may lead to a drop to $564. ❌
📌 Conclusion:
Watching for breakout confirmation before making any decisions. 🔎
Key levels: $627 (resistance) and $621 (support). 📍
Volume and price action will determine the next move. 📊
BNB/USDT:BUY LIMITHello friends
You can see that after the price fell, buyers entered the specified support area and supported the price and created higher ceilings and floors.
Now we can buy at the specified levels with capital and risk management and move to the specified targets.
*Trade safely with us*

PIUSDT Daily Technical AnalysisPIUSDT Daily Technical Analysis
Pi Network Coin indicators are NEGATIVE. The selling pressure on Pi Coin is still ongoing. Indicators are at a low position but still appear negative. If it can move sideways above the 0.92957 support level, the chances of recovery in the coming days may increase. The 0.92957 - 0.858 price levels are important support points.
It seems that the Pi Network team is somewhat weak in social communication. The applications created on the platform are still inactive, and the KYC period for users who joined before the Mainnet has now expired. There has been no explanation regarding the coins removed from accounts, or at least, we haven't seen one. In fact, no statement has been made on their YouTube channel either. If the coin does not break below these support levels, it could create a buying opportunity for positive price movements in the future. There is currently no clear information, so we will see how things develop.
NOT INVESTMENT ADVICE.
The information, comments, and recommendations provided here do not constitute investment advice. Investment advisory services are offered within the framework of an agreement between clients and brokerage firms, portfolio management companies, and non-deposit banks. The content on this page reflects only personal opinions. These views may not be suitable for your financial situation, risk tolerance, or return preferences. Therefore, investments should not be made based on the information and writings on this page.
To avoid missing our analyses of both positive and risky technical indicators, follow us and like our content—we would appreciate it!

WHY EURNZD IS BULLISH AGAING ?? DETAILED ANALYSISEUR/NZD is currently trading at approximately 1.886, having completed a retesting phase following a bullish breakout. This technical development suggests the potential for a renewed upward movement toward the target price of 1.9300. With strong bullish momentum building, traders are closely watching for confirmation signals to enter long positions.
Fundamentally, the Reserve Bank of New Zealand (RBNZ) recently implemented a 50 basis point rate cut, reducing the benchmark rate to 3.75%, with indications of further easing to stimulate the economy. This dovish monetary policy stance tends to exert downward pressure on the New Zealand dollar, thereby supporting the EUR/NZD pair. Meanwhile, the Eurozone has maintained a more stable monetary policy, contributing to euro strength relative to the New Zealand dollar. This divergence in central bank policies enhances the bullish outlook for EUR/NZD.
Technical indicators further reinforce this perspective. The pair has been in a downward channel since mid-February; however, recent bullish candles indicate a potential short-term reversal or correction. The price has swiftly moved from the lower Bollinger Band to the upper band, breaking through the middle band in a strong bullish move. Additionally, EUR/NZD is currently testing the 50% Fibonacci retracement level, a key decision point for traders.
Considering these technical and fundamental factors, the EUR/NZD pair appears poised for a bullish wave toward the 1.9300 target. Traders should monitor key resistance levels and employ appropriate risk management strategies to capitalize on this potential upward movement. If momentum continues, this setup could present a profitable long trade opportunity in the coming sessions.

Witness Magic of Statistical Models in Harmony with FibonacciWitness the Magic of Statistical Models in Harmony with Fibonacci Levels! ✨📊
Have you ever seen mathematical beauty unfold right before your eyes? 🤯 Imagine the elegance of statistical models perfectly aligning with Fibonacci levels—it's like witnessing a symphony of numbers! 🎶🔢
Fibonacci sequences, deeply rooted in nature and financial markets alike, provide a powerful tool for identifying key price levels. 📈✨ When combined with robust statistical models, they unveil patterns that might otherwise go unnoticed. The result? A mesmerizing blend of logic and intuition, precision and prediction! 🎯🔮
📌 Why is this combination so fascinating?
✅ Predictive Power – Fibonacci levels help anticipate market trends, while statistical models refine those predictions. 📊🔍
✅ Data-Driven Accuracy – Instead of relying on guesswork, this approach leverages solid mathematical foundations. 🏗️📈
✅ Aesthetic Elegance – There's something truly captivating about seeing numbers align so seamlessly! ✨🔢
So, what do you think of this remarkable harmony? 🤩 Let’s discuss in the comments! ⬇️
