1. Price structure
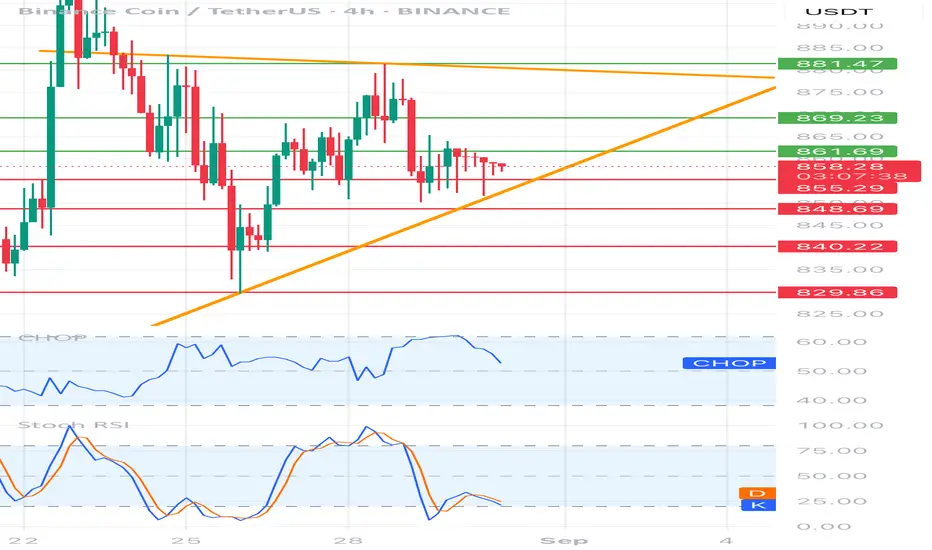
• Current price: ~ 858 USDT
• The price moves in the clinic in a lowering (yellow lines). Upper inheritance trend (~ 881) + lower growth line (~ 848).
• We see consolidation - the market is "squeezed" between supports and resistance.
2. Horizers of support and resistance
• Support:
• 855 (local, this is where the price stopped)
• 848 (Important - lower wedge + demand level)
• 840 and 829 (key with a larger decline).
• resistance:
• 861 (first test, short -term)
• 869 (stronger resistance, earlier reflections)
• 881 (upper wedge line, strategic resistance).
3. Oscillators
• RSI (Chop) - around 50, i.e. neutral → no clear advantage of bulls/bears.
• STOCHASTIC RSI - is located at the bottom of the zone (approx. 20-25), which suggests the possibility of reflecting up (bull signal, but only after the candle confirmation).
4. Scenarios
Bullish (reflection up):
• If the price persists over 855–848 → possible reflection to 861 and 869.
• Breaking above 869 → opens the road to 881 (Test of the upper line of Klina).
• Only closure of the 4h candle above 881 → a signal of a kick from the wedge and a stronger upward movement.
Bearish (continuation of the inheritance):
• If the price drops below 848 and closes the candle at this level → strong inheritance signal, tarpapers: 840 and 829.
• 829 is key support - its bursting down can deepen the declines.
⸻
📊 Summary
BNB is now in the Departing Clinic, in the uncertainty zone:
• Maintenance 848–855 = chance of reflection.
• Punction down 848 = signal to a stronger decrease.
• Only breaking above 881 = signal of stronger growth movement.
Disclaimer
The information and publications are not meant to be, and do not constitute, financial, investment, trading, or other types of advice or recommendations supplied or endorsed by TradingView. Read more in the Terms of Use.
Disclaimer
The information and publications are not meant to be, and do not constitute, financial, investment, trading, or other types of advice or recommendations supplied or endorsed by TradingView. Read more in the Terms of Use.