🧭 Key technical levels
Resistances:
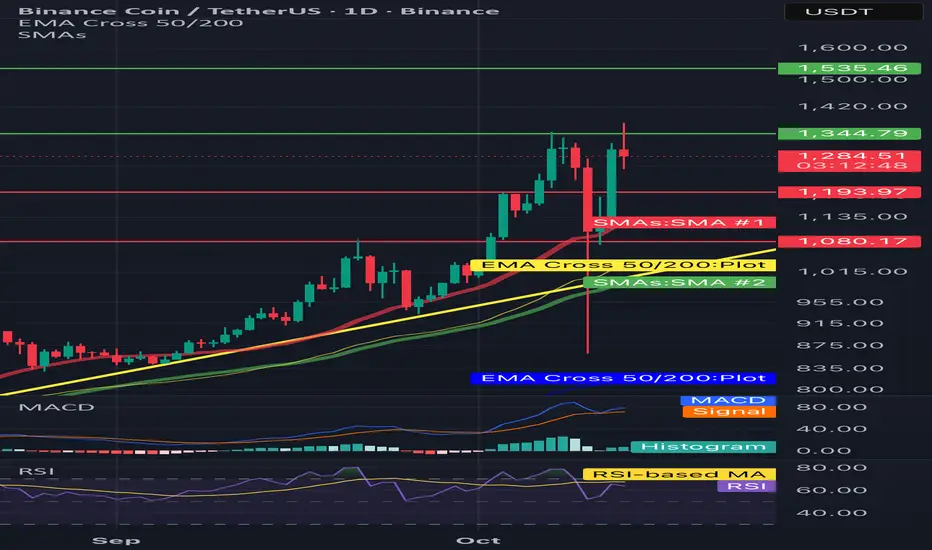
• 1,344–1,350 USDT – local resistance (last candle highs).
• 1,535 USDT – strong resistance from previous highs.
Support:
• 1,193–1,200 USDT – first strong support (the reaction of the candles is visible).
• 1,080 USDT – another important level, coincident with the yellow uptrend line and EMA50.
⸻
📊 Technical indicators
1.EMA/SMA:
• The red SMA and yellow EMA show that the medium-term trend is up (EMA 50 > EMA 200).
• The price is currently testing the zone between the SMA and EMA - if it stays above ~1,190-1,200, a rebound may occur.
2. MACD (bottom):
• The signal line (orange) crosses the MACD (blue) from above → bearish signal.
• The histogram is starting to flatten - possible end of correction if it lasts for a few days.
3.RSI:
• RSI around 50-55, neutral → no overbought or oversold yet.
• If the RSI rebounds from 50 upwards, it may mean the price rebounds from support.
⸻
📈 Scenarios
✅ Upward scenario (more likely if it maintains support)
• Maintaining above 1,190 USDT → reflection towards 1,344 and then 1,535.
• Confirmation: daily candle closed above 1,344 + increasing volume.
⚠️ Downside scenario
• Loss of the level of 1,190 USDT → correction to 1,080 USDT (EMA 50 test).
• If this support breaks, the next target is around USDT 950-1,000.
Resistances:
• 1,344–1,350 USDT – local resistance (last candle highs).
• 1,535 USDT – strong resistance from previous highs.
Support:
• 1,193–1,200 USDT – first strong support (the reaction of the candles is visible).
• 1,080 USDT – another important level, coincident with the yellow uptrend line and EMA50.
⸻
📊 Technical indicators
1.EMA/SMA:
• The red SMA and yellow EMA show that the medium-term trend is up (EMA 50 > EMA 200).
• The price is currently testing the zone between the SMA and EMA - if it stays above ~1,190-1,200, a rebound may occur.
2. MACD (bottom):
• The signal line (orange) crosses the MACD (blue) from above → bearish signal.
• The histogram is starting to flatten - possible end of correction if it lasts for a few days.
3.RSI:
• RSI around 50-55, neutral → no overbought or oversold yet.
• If the RSI rebounds from 50 upwards, it may mean the price rebounds from support.
⸻
📈 Scenarios
✅ Upward scenario (more likely if it maintains support)
• Maintaining above 1,190 USDT → reflection towards 1,344 and then 1,535.
• Confirmation: daily candle closed above 1,344 + increasing volume.
⚠️ Downside scenario
• Loss of the level of 1,190 USDT → correction to 1,080 USDT (EMA 50 test).
• If this support breaks, the next target is around USDT 950-1,000.
Disclaimer
The information and publications are not meant to be, and do not constitute, financial, investment, trading, or other types of advice or recommendations supplied or endorsed by TradingView. Read more in the Terms of Use.
Disclaimer
The information and publications are not meant to be, and do not constitute, financial, investment, trading, or other types of advice or recommendations supplied or endorsed by TradingView. Read more in the Terms of Use.