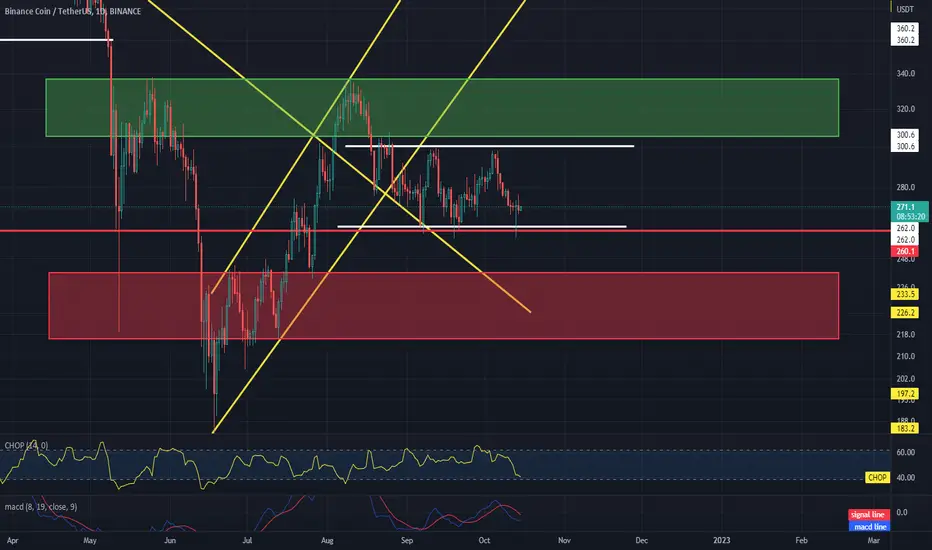
Hello everyone, let's take a look at the BNBUSDT chart on the 1 day time frame, as you can see we left the uptrend channel and we are currently moving in the sideways channel where the price is accumulating.
As you can see, we are at the bottom of the channel, which can be used for short-term licks.
As you can see, we have the first support right at the lower end of our current channel, then we have a strong support zone.
However, after leaving the current channel, we have a strong zone of resistance to further increases.
The CHOP indec indicates that the energy has run out and the MACD indicator shows a downtrend.
Disclaimer
The information and publications are not meant to be, and do not constitute, financial, investment, trading, or other types of advice or recommendations supplied or endorsed by TradingView. Read more in the Terms of Use.
Disclaimer
The information and publications are not meant to be, and do not constitute, financial, investment, trading, or other types of advice or recommendations supplied or endorsed by TradingView. Read more in the Terms of Use.