BNBUSDT Weekly Chart – Full Analysis
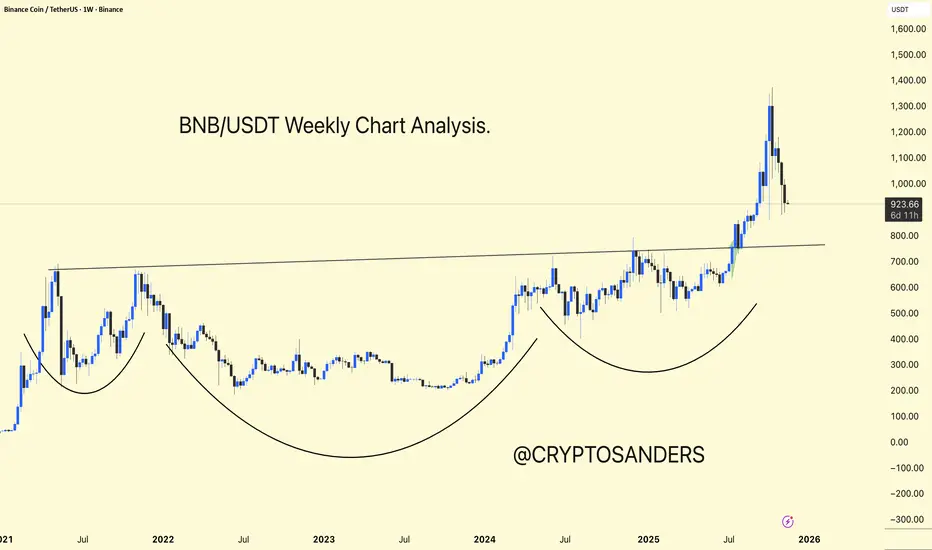
BNB is displaying a multi-year Inverse Head and Shoulders structure on the weekly chart, which is a bullish continuation pattern that indicates accumulation followed by a breakout.
Key Breakout: Horizontal resistance near $800 serves as a neckline for the pattern. BNB broke above this level with strong volume, confirming the bullish breakout and initiating a sharp uptrend.
Current Activity: After reaching above $1,300, BNB is currently retracing and testing the breakout area as support ($800–$900). This is a standard retest after a significant uptrend.
Bullish Scenario: If BNB holds $800–$900, a strong upward trend toward new all-time highs is likely, with targets potentially reaching $1,500 and above, measured using cup depth.
Bearish Risk: Losing the $800 neckline would invalidate the current breakout and could lead to a deeper retracement before another upward move.
BNB is in a strong long-term uptrend. After successfully breaking out of a massive cup-and-handle pattern, it is retesting support—a natural and healthy technical move. Holding above $800–$900 keeps BNB in a bullish setup, with further upside potential.
DYOR | NFA
Related publications
Disclaimer
The information and publications are not meant to be, and do not constitute, financial, investment, trading, or other types of advice or recommendations supplied or endorsed by TradingView. Read more in the Terms of Use.
Related publications
Disclaimer
The information and publications are not meant to be, and do not constitute, financial, investment, trading, or other types of advice or recommendations supplied or endorsed by TradingView. Read more in the Terms of Use.