This analysis is an update of the analysis you see in the "Related publications" section
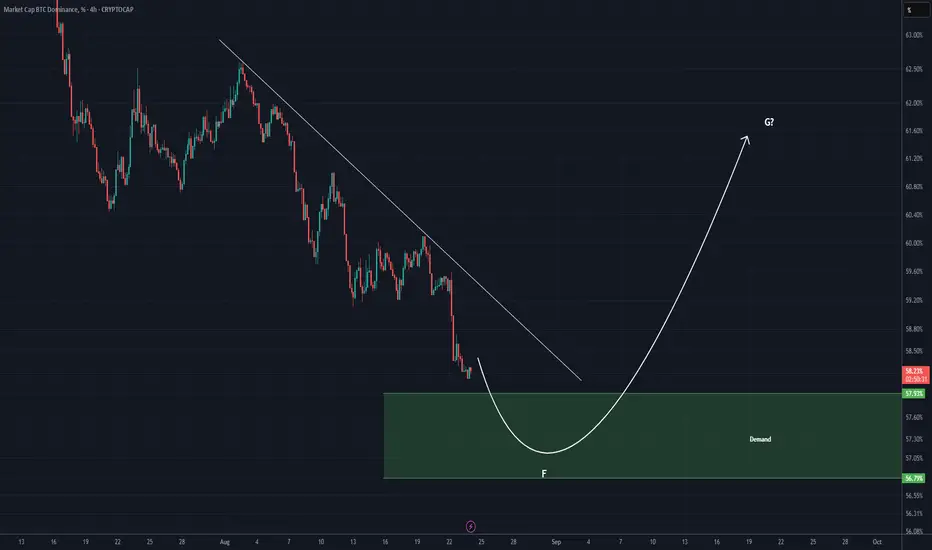
As expected from the previous analysis, we anticipated a drop in this index, and the drop is currently in progress.
One important point to note is the green zone, which is a strong support area. It is possible that the diametric/symmetrical structure we discussed in earlier analyses is still intact. In that case, wave F of this diametric pattern may complete in the green zone, and candles could then enter wave G | a bullish wave that may trigger a significant correction in altcoins.
For risk management, please don't forget stop loss and capital management
When we reach the first target, save some profit and then change the stop to entry
Comment if you have any questions
Thank You
Trade active
It was supported from the green zone and seems likely to move up toward one of the two red lines, which may increase selling pressure on altcoins. A rejection could occur from either of the marked red lines.Trade closed: target reached
Eventually, the Bitcoin dominance wave G was hit, and strong pressure was exerted on the altcoins.🔆To succeed in trading, just enter our Telegram channel:
Free membership: t.me/Behdark_EN
🔷Our Telegram channel has daily spot and futures signals 👉 t.me/Behdark_EN
💎 Exclusive signals are only shared on our Telegram channel
Free membership: t.me/Behdark_EN
🔷Our Telegram channel has daily spot and futures signals 👉 t.me/Behdark_EN
💎 Exclusive signals are only shared on our Telegram channel
Related publications
Disclaimer
The information and publications are not meant to be, and do not constitute, financial, investment, trading, or other types of advice or recommendations supplied or endorsed by TradingView. Read more in the Terms of Use.
🔆To succeed in trading, just enter our Telegram channel:
Free membership: t.me/Behdark_EN
🔷Our Telegram channel has daily spot and futures signals 👉 t.me/Behdark_EN
💎 Exclusive signals are only shared on our Telegram channel
Free membership: t.me/Behdark_EN
🔷Our Telegram channel has daily spot and futures signals 👉 t.me/Behdark_EN
💎 Exclusive signals are only shared on our Telegram channel
Related publications
Disclaimer
The information and publications are not meant to be, and do not constitute, financial, investment, trading, or other types of advice or recommendations supplied or endorsed by TradingView. Read more in the Terms of Use.