Hello
It's a Bitcoin Guide.
If you "follow"
You can receive real-time movement paths and comment notifications on major sections.
If my analysis was helpful,
Please click the booster button at the bottom.

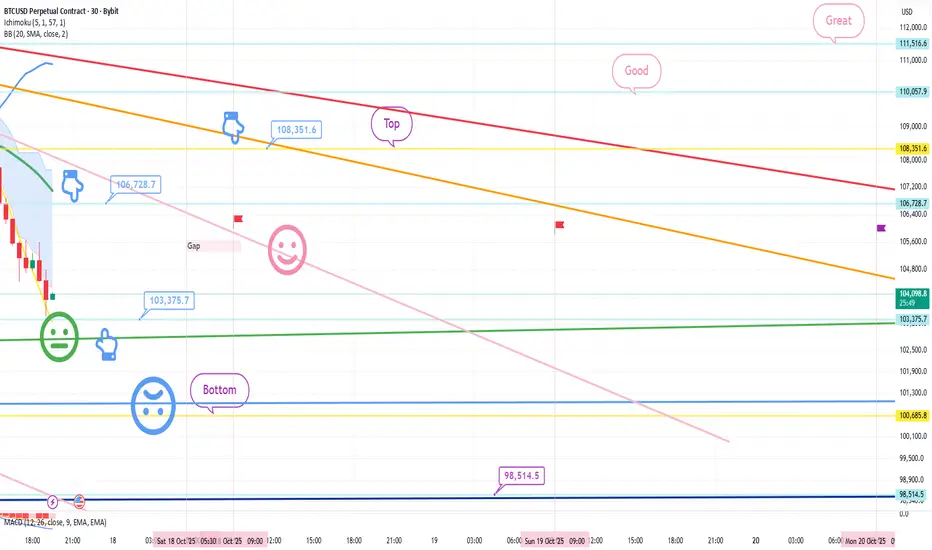
This is Bitcoin's 30-minute chart.
There are no Nasdaq data releases today.
Bit has been falling sharply since yesterday and today, as it has been coupled with the Nasdaq.
I've been thinking a lot about the possibility of further declines.
*When the light blue finger moves,
Bidirectional neutral
Short->Long switching or final long position strategy
1. $106,728.7 short position entry point / Stop-loss price upon breaking the pink resistance line
2. $103,375.7 long position switching / Stop-loss price upon breaking the green support line
3. Long position target prices, starting from the top section at the top
If the price falls immediately without touching the short entry point at 106.7K,
the final long position is at the bottom section at the bottom.
The bottom section is a double bottom, where the previous low is broken.
Because the lower tail may be pushed to $98,514.5, indicated at the bottom,
rather than placing a limit order,
we recommend switching long positions after confirming a trend reversal on the 5-minute chart.
More importantly, the Nasdaq movement appears to be the most important. It's frustrating that Bitcoin is coupled with the Nasdaq, which plummets at crucial moments, but it seems the coin market has never been easy.
At least if you're trading in real time, in a market where some people lose money while others make money, giving up would only hurt you.
In times like these, it's crucial to stay focused and practice principled trading and stop-loss orders.
Thank you for your hard work this week.
It's a Bitcoin Guide.
If you "follow"
You can receive real-time movement paths and comment notifications on major sections.
If my analysis was helpful,
Please click the booster button at the bottom.
This is Bitcoin's 30-minute chart.
There are no Nasdaq data releases today.
Bit has been falling sharply since yesterday and today, as it has been coupled with the Nasdaq.
I've been thinking a lot about the possibility of further declines.
*When the light blue finger moves,
Bidirectional neutral
Short->Long switching or final long position strategy
1. $106,728.7 short position entry point / Stop-loss price upon breaking the pink resistance line
2. $103,375.7 long position switching / Stop-loss price upon breaking the green support line
3. Long position target prices, starting from the top section at the top
If the price falls immediately without touching the short entry point at 106.7K,
the final long position is at the bottom section at the bottom.
The bottom section is a double bottom, where the previous low is broken.
Because the lower tail may be pushed to $98,514.5, indicated at the bottom,
rather than placing a limit order,
we recommend switching long positions after confirming a trend reversal on the 5-minute chart.
More importantly, the Nasdaq movement appears to be the most important. It's frustrating that Bitcoin is coupled with the Nasdaq, which plummets at crucial moments, but it seems the coin market has never been easy.
At least if you're trading in real time, in a market where some people lose money while others make money, giving up would only hurt you.
In times like these, it's crucial to stay focused and practice principled trading and stop-loss orders.
Thank you for your hard work this week.
Trade closed: stop reached
Hello,It's a Bitcoin Guide.
I'll check the movement since the analysis was written on October 17th.
This is a 30-minute chart of the Nasdaq.
I've marked key areas with black fingers.
The light blue finger indicates a short-to-long switching strategy.
After entering a short position at 24,472.2 points,
it broke through the orange resistance line.
Good -> It rose to 24.9K.
Last week, the intermediate-term pattern was broken,
and the price closed strong with minimal fluctuations.
Due to the Nasdaq's volatility, a new all-time high is imminent.
Due to last week's movement, the MACD death cross on the weekly chart is being ignored.
This is a 30-minute chart of Bitcoin. I've marked the key areas with black fingers.
Similar to the Nasdaq,
using the short->long switching strategy with the light blue fingers,
after entering a short position at $106,728.7 at the top,
the price closed sideways.
While moving sideways, it broke through the pink and orange resistance lines over the weekend, and a new weekly candlestick formed,
reaching the Great Target Price.
The strategy is to cut losses.
While it's fortunate that Bitcoin has rebounded,
unconditional forced coupling to the Nasdaq is not ideal.
If a rebound occurs without even a minimal surge,
the likelihood of another decline increases.
Since the Nasdaq hasn't reached a new high,
we need to carefully examine the overall situation.
Furthermore, last week's movement created a Gap8 zone at the bottom,
there are many areas to watch this week. GIMP has also risen significantly, so please take advantage of it.
Especially during these volatile times,
please be sure to adhere to your trading principles and stop-loss orders.
Thank you.
Note
Hello,It's a Bitcoin Guide.
I'll check the movement after writing the analysis on October 20th.
This is the Nasdaq 30-minute chart.
I've marked the major sections with black fingers.
In the red finger long position strategy,
it didn't fall to the lower level of 24,812.5 points,
but touched the first section (vertical rise) marked above,
and continued its vertical rise.
It reached the target price of 25,144.4 points at the top,
and a new high was recorded from the top.
Yesterday's movement on the Nasdaq daily chart resulted in a MACD golden cross.
It continues to rise without any significant fluctuations.
This is the Bitcoin 30-minute chart. I've marked the key areas with black fingers.
In the red finger long position strategy, the price moved sideways until dawn,
failing to break through the pink resistance line.
After touching the long position entry point of $110,043.7,
it rose around $1,200,
and then closed in extreme sideways range within the pink resistance line at the top.
With the creation of additional daily candles today,
a strong correction has occurred, leading to a decline to the bottom->1 area,
marked below.
The Bitcoin price is in a roller coaster mode,
without any waves or entry points.
Since this is a potential short-term take-profit or short-term position after a long entry,
the strategy is manual liquidation.
It was coupled during the Nasdaq crash.
Yesterday, it decoupled from a vertical rise,
and then coupled during the correction at 11:30 AM.
After checking the BTC, which is moving completely on its own, and thinking about the reason,
it appears to be due to a break in the long-term pattern.
The signals don't seem to be causing any major problems yet.
The Nasdaq appears likely to continue rising.
BTC is approaching the Gap8 level at the bottom in the short term and the support line in its long-term pattern.
Don't give up, especially in difficult markets.
Just remember to trade on principle, set a stop loss, and follow the trend.
Thank you.
Note
Hello,It's a Bitcoin Guide.
I'll check the movement since writing the analysis on October 21st.
This is a 30-minute chart of the Nasdaq.
I've marked key sections with black fingers.
*In the red finger long position strategy,
after entering a short position at the top (purple finger 1st section) ->
switching to a long position at 25,056.3 at the bottom.
The price rose slightly below the target price of 25,182.7 points and closed.
It failed to break through the final orange resistance line.
Today, a new daily candlestick formed,
and after breaking through the orange resistance line, it fell near the green support line.
It's playing around, moving sideways before reaching a new high.
I'll explain the details in the analysis.
This is a 30-minute Bitcoin chart.
I've marked key sections with black fingers.
*In the red finger long position strategy,
after touching the purple 1st upward wave confirmation section at the top,
it did not fall to the 2nd vertical upward section at the bottom,
but instead broke strongly to the Top -> Good target price.
After touching the red resistance line, it closed with a sharp downward movement.
Today, a new daily candlestick was created,
it bypassed the 2nd section,
and is currently trading sideways, watching the Nasdaq closely.
Since it hasn't reached the entry point,
the strategy has been canceled.
Yesterday, it touched the 1st section,
and many people saw a trend reversal on the 5-minute chart.
I'm not sure if they made a profit.
Recent Bitcoin performance suggests that the situation is not very good. There's no volatility, no justification, and it's selectively coupled with the Nasdaq.
In times like these, it's crucial to be patient and wait for the market to open.
I won't take a risky, greedy position.
You should operate with discipline, stop-loss requirements, and trend-following.
I'll keep working hard today.
Thank you.
Note
Hello,It's a Bitcoin Guide.
I'll check the movement after writing the analysis on October 22nd.
This is a 30-minute chart of the Nasdaq.
I've marked the major sections with black fingers.
The light blue fingers indicate a short-to-long switching strategy.
At 10:30 PM, the US market opened,
and the price continued to fall vertically without touching the first section at the top.
Ignoring the bottom section of the 1+4 pattern,
it fell to 24,690.7 points, indicated at the bottom.
Yesterday's movement broke the mid-term pattern again,
and a MACD death cross is in progress on the 12-hour chart.
This is a 30-minute chart of Bitcoin. I've marked the key areas with black fingers.
*In the bottom left, in the analysis article on the 21st,
the purple finger indicates the long position entry point (Gap 8) at $107,009/$5.
After the final entry, I continued the strategy.
After the first purple finger touches the top (the first autonomous short touch)
(same as the Nasdaq, the correction begins at 10:30 PM)
it fails to break through the pink resistance line
and switches to a long position at $107,146.8 with the red finger below.
It then breaks the purple support line and finishes with a slight rebound.
With the formation of a new daily candle,
the rebound is currently near the orange resistance line.
As indicated, the long->short->long switching is working perfectly.
Unlike the Nasdaq, the sharp decline occurred early,
so it was able to withstand the correction.
It also appears that strength is being refocused on Bitcoin as XAUUSD (Gold) loses strength.
I'll proceed with the active strategy and proceed with today's analysis.
I've been moving around so arbitrarily lately, it's been so hard to achieve perfection, haha.
Thank you.
*비트코인가이드 공식텔레그램 Telegram
t.me/BTG_Group
*빙엑스 BingX 50%DC+$5,000 (총1회수수료)
bingx.com/invite/YBM3A4
*바이비트 Bybit 20%DC+$5,020
partner.bybit.com/b/Bitcoin_Guide
*앞으로는 하단의 네이버카페에서만 활동합니다.
cafe.naver.com/loanlife82
t.me/BTG_Group
*빙엑스 BingX 50%DC+$5,000 (총1회수수료)
bingx.com/invite/YBM3A4
*바이비트 Bybit 20%DC+$5,020
partner.bybit.com/b/Bitcoin_Guide
*앞으로는 하단의 네이버카페에서만 활동합니다.
cafe.naver.com/loanlife82
Related publications
Disclaimer
The information and publications are not meant to be, and do not constitute, financial, investment, trading, or other types of advice or recommendations supplied or endorsed by TradingView. Read more in the Terms of Use.